Key takeaways
- Three temperatures matter: air, module back surface and cell. Sandia’s model finds the back surface, then adds a cell offset of 3 °C at 1,000 W/m² in the open-rack set.
- Take an example hot afternoon (30 °C air, 900 W/m², 2 m/s wind). The open-rack set gives a 54.9 °C back surface. The cell is 57.6 °C.
- With an example -0.30 %/°C coefficient, that cell loses 9.8% of a 400 W rating (360.9 W). Using the 30 °C air instead would show only 1.5%.
- Mounting moves the answer most. Close mount is 14.9 °C hotter than open rack.
- Four models on open rack differ by only 4.9 °C in cell temperature (53.3 to 58.1 °C). The PVsyst-type row uses its published default efficiency of 0.1. At 0.2 it is 52.3 °C, and the model spread widens to 5.8 °C.
To model cell temperature in a yield run, see the best solar simulation software.
Ambient and cell temperature at a glance
A thermal model turns weather inputs into a cell temperature. The temperature coefficient then gives the power loss.
| Item | Detail |
|---|---|
| Formula (Sandia) | Tm = E × exp(a + b × WS) + Ta, then Tc = Tm + E ÷ E0 × ΔT, with E0 = 1,000 W/m². |
| Unit / typical range | °C. Inputs: air temperature (°C), irradiance E (W/m²) and wind speed WS (m/s). No sourced typical cell-above-air range is quoted here. The worked example is example. |
| Where it matters | Hot-day power in a yield simulation, and comparing roof and ground mounting. |
| Standard or rule | pvlib’s docstring says IEC 61853 adopted the Faiman model. This page does not quote the standard. |
| In software | Modelled each time step from weather data and a mounting choice. |
Why do ambient and cell temperature matter for installers?
Power falls as cells heat. In sunshine, cells run above the air. If you apply the coefficient to air temperature, you understate the loss. Mounting also changes the cell temperature.
The temperature coefficient page covers the per-degree maths. For cold-day voltage, see cold temperature voltage correction. The loss diagram shows losses. A derate factor does not include cell temperature, so you use the two together. See also performance ratio and energy yield simulation.
What are ambient, back-surface and cell temperature, and why is the cell hotter?
Ambient temperature is the air temperature near the array. Back-surface temperature is taken behind the module. Cell temperature is the temperature of the cells inside the laminate.
Sandia’s PVPMC says module temperature "depends on a number of factors, including air temperature, irradiance, wind speed, and module materials". It calls predicting module temperature "the first step in estimating cell temperature".
The cell runs hotter than the air. Sunlight that does not become electricity turns into heat. HOMER’s help (updated 19 October 2026) writes the balance as ταG = ηG + UL(Tc − Ta). The PVsyst-type form on Sandia’s PVPMC page has a heat term α(1 − ηm). Its defaults of 0.9 and 0.1 make that 0.81 of the irradiance.
The cell is warmer than the back surface. Sandia’s cell temperature page says the difference parameter "defines the temperature difference between the module and cell temperature". The pvlib docstrings list the offset at 1,000 W/m². It is 3 °C for glass/glass open rack, 1 °C for close mount and 0 °C for insulated back. A Sandia paper (SAND2016-5287C, date not printed) says "typically 3°C".
An NLR (formerly NREL) workshop talk (NREL/PR-520-49505, 22 to 23 September 2010) measured the backskin. It "assumed cell is 1.3 C hotter at NOCT". The figures come from different modules and irradiances (800 against 1,000 W/m²). Do not compare them directly. Both show an offset of a few degrees.
Which models turn ambient temperature into cell temperature?
Four model families are common: Sandia (SAPM), Faiman, PVsyst-type heat balance and NOCT-type. Each takes air temperature and irradiance. Most take wind speed too.
| Model | Equation as printed | Output as labelled | Source and date |
|---|---|---|---|
| Sandia (SAPM) | Tm = E × exp(a + b × WS) + Ta. Tc = Tm + E ÷ E0 × ΔT | Back-surface Tm, then cell Tc | Sandia PVPMC, metadata 2 January 2026. Pvlib 0.16.1 |
| Faiman | Tm = Ta + E ÷ (U0 + U1 × WS) | Module temperature (pvlib: cell or module) | Sandia PVPMC, metadata 28 November 2022 |
| PVsyst-type | Tc = Ta + E × α × (1 − ηm) ÷ (Uc + Uv × WS) | Cell temperature | Sandia PVPMC, metadata 9 June 2025 |
| NOCT-type (simple) | Tcell = Tair + G × (NOCT − 20) ÷ 800 | Cell temperature | Penn State AE 868, no date shown |
The Faiman page prints a combined fit of U0 = 25 and U1 = 6.84. It comes from seven module types with glass fronts and Tedlar backs. pvlib’s docstring says IEC 61853 use "does not distinguish between cell and module temperature".
The PVsyst-type page gives Uc = 29 and Uv = 0 for free-standing arrays. For fully insulated arrays it gives Uc = 15 and Uv = 0. Uv = 0 means no wind term. You can enter a NOCT instead, and PVsyst works out the U values.
Penn State defines NOCT as the cell temperature at 800 W/m², 20 °C air and 1 m/s wind. Sandia’s NOCT page adds mounting and wind adjustments. For mounting, it adds 2 °C to NOCT for a 2.5 to 3.5 inch stand-off, 6 °C for 1.5 to 2.5 inches, 11 °C for 0.5 to 1.5 inches and 18 °C for 0.0 to 0.5 inches, with no addition for an open rack. For wind, it scales the measured wind speed by 0.51 for single-storey installations and 0.61 for others, citing Gilman et al., 2018 (NREL/TP-6A20-67399). pvlib’s noct_sam takes a stand-off distance in inches and a wind adjustment that match this. Check the values in the current source. See NOCT and NMOT and standard test conditions.
How do wind and mounting change the cell temperature?
More wind lowers the cell temperature, and a ventilated rear lowers it more. In Sandia’s model, mounting enters through a, b and ΔT.
pvlib’s docstring sets out three mounting cases. They depend on the air flow behind the module. "Open rack" is "typical of ground-mounted systems on fixed racking or single axis trackers". "Close mount" is "typical of roof-mounted systems with some gap behind the module". "Insulated back" has "no air flow contacting the rear surface".
Wind height matters. pvlib’s Sandia functions take wind at 10 m. Its other models take wind "measured at the same height for which the wind loss factor was determined".
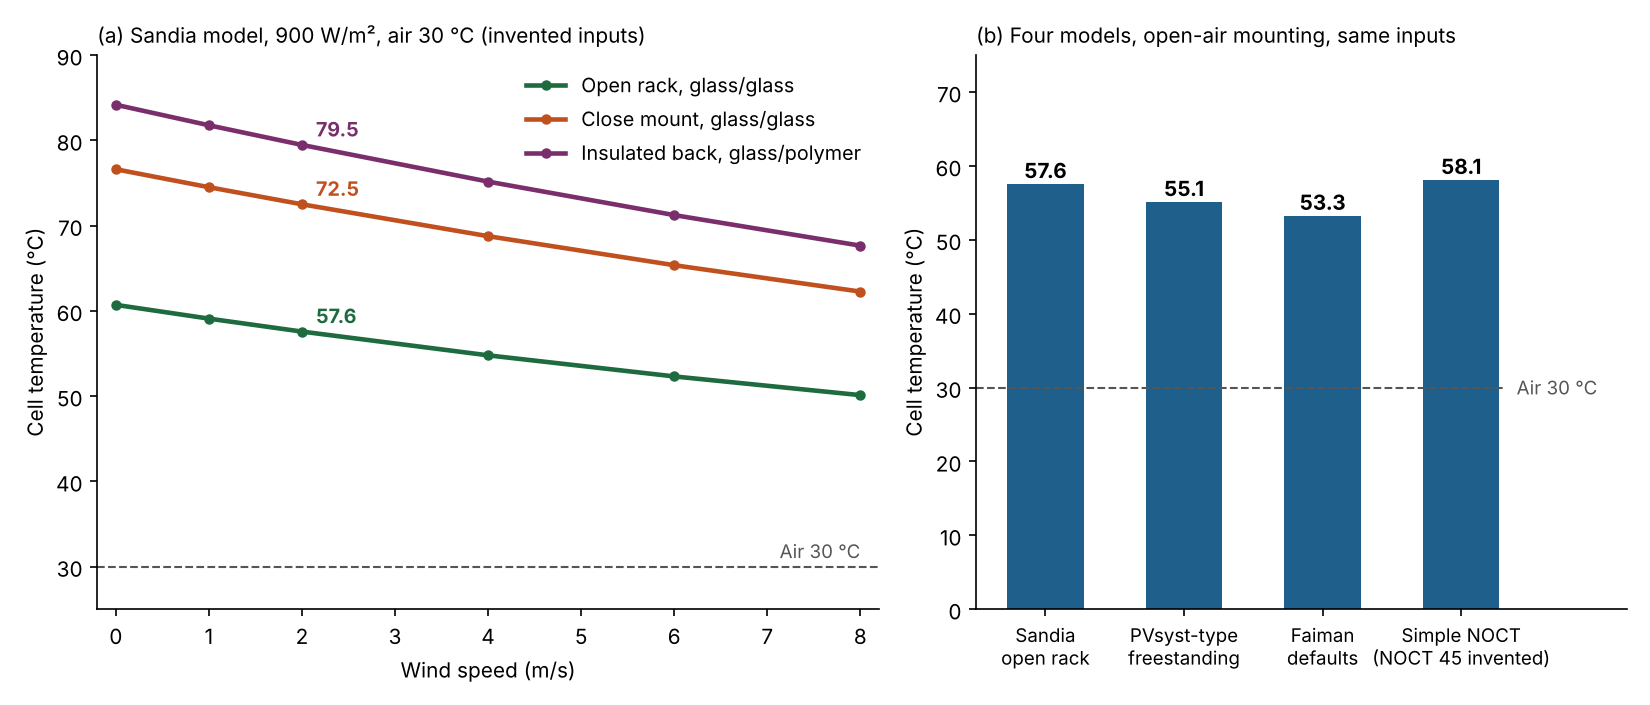
Figure 1. With example inputs (30 °C air, 900 W/m², 2 m/s), the Sandia cell sits 27.6 to 49.5 °C above the air by mounting, and four models differ by 4.9 °C on open racks (PVsyst-type efficiency 0.1).
On an open rack, wind from 0 to 8 m/s cools the example cell by 10.6 °C. That is for these parameters.
Worked example: from 30 °C air to a cell temperature
Take the Sandia open-rack glass/glass set, 30 °C air, 900 W/m² and 2 m/s wind. The cell is 57.6 °C. All inputs, the coefficient and the rating are example.
- Back surface: Tm = 900 × exp(−3.47 − 0.0594 × 2) + 30 = 900 × 0.02763 + 30 = 54.9 °C.
- Cell: Tc = 54.9 + 900 ÷ 1,000 × 3 = 57.6 °C, which is 27.6 °C above the air.
- Temperature factor, with an example -0.30 %/°C: 1 − 0.0030 × (57.57 − 25) = 0.9023. The 400 W example rating becomes 360.9 W (9.8% lower).
The table below shows how the mounting set changes the result. The other two printed sets use the same inputs.
| Sandia set (all inputs example) | Back surface, °C | Cell, °C (above air) | Temperature factor | Rating after factor, W |
|---|---|---|---|---|
| Open rack, glass/glass | 54.9 | 57.6 (27.6 above air) | 0.9023 | 360.9 |
| Close mount, glass/glass | 71.6 | 72.5 (42.5 above air) | 0.8575 | 343.0 |
| Insulated back, glass/polymer | 79.5 | 79.5 (49.5 above air) | 0.8366 | 334.6 |
Close mount is 14.9 °C hotter than open rack and costs 17.9 W of the 400 W. "Rating after factor" is the rating times the temperature factor only. It has no irradiance scaling or other losses.
Now run the four models on open-air mounting with the same inputs. The table shows the four cell temperatures side by side.
| Model (open-air mounting) | Cell, °C | Rating after factor, W |
|---|---|---|
| Sandia, open rack, glass/glass | 57.6 | 360.9 |
| PVsyst-type, free-standing defaults | 55.1 | 363.8 |
| Faiman, default coefficients | 53.3 | 366.1 |
| Simple NOCT, example NOCT of 45 °C | 58.1 | 360.3 |
The inputs are the example ones above. The four cell temperatures span 4.9 °C, which is 5.8 W of rating.
The PVsyst-type row uses the published default module efficiency of 0.1. At an efficiency of 0.2 it gives 52.3 °C, and the four cell temperatures then span 5.8 °C. Each model sets wind at its own height, yet the same 2 m/s feeds all four.
Ambient to cell temperature calculator
The defaults are the example inputs above. PVsyst-type rows use module efficiency 0.1. A higher efficiency lowers the result. Semi-integrated Uc = 20 is from the pvlib table. The values 29 and 15 are on Sandia’s PVsyst page.
How solar software handles cell temperature
All five tools name their method. What differs is depth: PVsyst prints no default U values, HelioScope gives no equations or defaults, and HOMER lists no wind input. Ratings test the help page, not the model.
The table compares what each help page documents. Not stated means the page we cite does not say.
| Software | Cell temperature from ambient? | Wind input? | Equations printed? |
|---|---|---|---|
| pvlib python | Yes | Yes | Yes (docstrings) |
| PVsyst | Yes | Not stated | Not stated |
| HelioScope | Yes | Yes | Not stated |
| HOMER Pro | Yes | Not stated | Yes (energy balance) |
| PV*SOL | Yes | Not stated | Not stated |
- pvlib python: The temperature reference lists sapm_cell and sapm_module (back surface), pvsyst_cell, faiman, fuentes, ross and noct_sam, among others. Read: pvlib 0.16.2.dev docs page (no date, version shown) and 0.16.1 docstrings, checked October 2026.
- PVsyst: The help says a "thermal balance model outputs the steady-state temperature" and a thermal inertia model then computes the transient one. U-values "must be fitted to real system data" and the user can change them. Read: PVsyst help, "Array thermal losses", no date shown, checked October 2026. The page prints no default U values.
- HelioScope: The help lists a "Sandia Temperature Model" and a diffusion model that matches PVsyst’s. Wind speed and module irradiance enter the models. Racking types are listed. Read: HelioScope help, "Cell Temperature Model", no date shown, checked October 2026. No equations or defaults on the page.
- HOMER Pro: The help prints an energy balance with a NOCT relation. Inputs are air temperature, array irradiance, NOCT, STC efficiency, the power coefficient and τα (0.9). It lists no wind input. Read: HOMER support, "pv cell temperature", updated 19 October 2026, checked October 2026.
- PV*SOL: A static model for hourly steps adds a heating offset ΔT by installation type, from 20 K (floating PV) to 43 K (roof-integrated, not ventilated). A dynamic model covers one-minute steps. Wind is not mentioned. Read: PV*SOL help, "Module temperature" (2022 path), no date shown, checked October 2026. The help page text shows no formulas.
To compare simulation tools beyond these five, see our ranked list of the best solar simulation software. For the library, see pvlib.
Common mistakes with ambient and cell temperature
FAQs
How hot do solar panels get?
In our example, a cell reaches 57.6 °C on an open rack and 72.5 °C on a close mount, with 30 °C air and 900 W/m². These are labelled example values, not a field range. Wind and mounting change them.
Is cell temperature the same as module temperature?
Not always. Sandia’s model gives a back-surface module temperature and adds an offset for the cell. The IEC 61853 use of Faiman does not distinguish the two, per pvlib’s docstring. Check which one a tool means.
Do all models use wind speed?
No. Sandia and Faiman do. The simple NOCT formula has no wind term, though Sandia’s NOCT page adds a wind adjustment. The PVsyst-type defaults have Uv = 0, so they ignore wind. HOMER’s help lists no wind input.
Which cell temperature should I use for the temperature coefficient?
Use the cell temperature, not the air. The coefficient is set against cell temperature from 25 °C. See the temperature coefficient page for units and conversions.
Where does NOCT fit in?
NOCT is a rating: the cell temperature at 800 W/m², 20 °C air and 1 m/s wind. A simple formula then estimates cell temperature from air and irradiance. It has no mounting or wind detail unless the model adds them.
Related terms
- Temperature coefficient: the per-degree change in power, voltage or current.
- NOCT and NMOT: the operating-temperature rating on a datasheet.
- Solar panel module: the laminate and frame whose construction sets the thermal parameters.
- Vmp and Imp: the peak-power voltage and current, which also shift with cell temperature.
- Derate factor: a single multiplier for system losses that excludes cell temperature.
Next step: test your own mounting and wind inputs in the best solar simulation software, or try the best free solar calculators for installers.
Sources
- Sandia PVPMC pages (checked October 2026, metadata dates). module temperature (28 September 2022). Sandia module model (2 January 2026). Faiman (28 November 2022). Sandia cell model (2 January 2026). PVsyst cell model (9 June 2025). NOCT cell temperature (27 June 2023).
- pvlib 0.16.1 docstrings for sapm_module, sapm_cell, faiman, pvsyst_cell and noct_sam (checked October 2026).
- pvlib, PV temperature models (version 0.16.2.dev, no date, checked October 2026).
- pvlib, noct_sam and pvsyst_cell (no date, checked 30 October 2026).
- NREL, Measuring and Modeling NOCT, NREL/PR-520-49505 (22 to 23 September 2010, checked October 2026).
- Sandia, SAND2016-5287C, Outdoor Test and Analysis Procedures for the Sandia Array Performance Model (date not printed, checked October 2026).
- Penn State AE 868, Temperature and PV Performance Optimization (no date shown, checked October 2026).
- HOMER, pv cell temperature (updated 19 October 2026, checked October 2026).
- PVsyst, array thermal losses (no date shown, checked October 2026).
- HelioScope, Cell Temperature Model (no date shown, checked October 2026).
- PV*SOL, Module temperature (2022 path, no date shown, checked October 2026).
Last updated 30 October 2026. Next scheduled review: 30 January 2027.