Key takeaways
- This example’s 8 kW example costs 0.155 USD per kWh to generate (5% real discount rate, 25 years). One grid price meets it, 0.220 USD. Three fall short: 0.140, 0.104 and 0.060.
- In that example, a real rise of 1.1% a year lifts the 0.140 price to parity. The 0.104 blend needs 4.0%. The 0.060 wholesale-type price needs 8.7% (example).
- EIA’s 2025 US averages are 17.30 cents per kWh for residential, 13.41 for commercial and 8.62 for industrial customers. One year gives three "grid prices".
- Branker, Pathak and Pearce say parity is considered when PV’s LCOE is comparable with grid prices.
- A parity year is an output of two assumptions: how fast the grid value rises and how fast the installed price falls.
To model LCOE, rate escalation and incentives in software, see the best solar financial modeling software.
Grid parity at a glance
Grid parity compares what solar costs per kWh with what the grid charges per kWh. It holds when the grid value is at or above the solar cost.
| Item | Detail |
|---|---|
| Formula | Levelised grid value per kWh ≥ solar LCOE per kWh, both in real or both in nominal money. |
| Unit and range | Currency per kWh. Our example case: 0.155 USD cost against grid values of 0.060 to 0.220 USD. EIA’s 2025 US class averages run from 8.62 to 17.30 cents per kWh. |
| Where it matters | Sales claims, proposals and the case for solar without a subsidy. See LCOE, NPV and incentives. |
| Standard or rule | No standard found. Definitions differ in the price compared and in whether subsidies count. |
| In software | Four tools report an LCOE. Energy Toolbase reports a net lifetime figure it calls LCOE. Only Aurora’s and SAM’s pages state the comparison with a utility or retail rate. |
Why does grid parity matter for installers?
It decides whether "cheaper than the grid" holds up. A claim made on the wrong price can fail when the customer reads the bill.
The same system can pass against one price and fail against another, as Figure 1 shows. A proposal should say which grid price, over what years, and with or without incentives. Parity is a screening test. It does not replace ROI or NPV, and it says nothing about when savings arrive.
The LCOE page covers the cost side. Net metering and net billing cover what an exported kWh earns. This page covers the comparison between them.
Which grid price should you compare with?
Compare with the price the system displaces, and say whose view you take. Wikipedia notes parity depends on whether the figures are calculated from the point of view of a utility or of a retail consumer. For behind-the-meter solar, that is the part of the bill that falls when the system runs. It can be below the average bill. For a utility-scale plant, it is the wholesale price.
Grist (15 January 2012) compared rooftop solar with the retail price on the utility bill. It compared utility-scale solar with the wholesale cost of new power.
The table lists four grid price bases and when each fits.
| Basis | What it measures | Used for | Watch for |
|---|---|---|---|
| All-in average retail | Total bill divided by kWh | Quick screening | Includes fixed charges that solar does not remove. |
| Avoided energy charge | The per-kWh charge that falls when solar runs | Behind-the-meter proposals | Varies by tariff, tier and time of day. See tariff rate databases. |
| Value blend | On-site share × avoided charge + export share × export price | Sites that export | Needs the export rule. See self-consumption. |
| Wholesale price | What the market pays generators | Utility-scale plants. See solar farm. | Changes by hour and market. |
Retail prices differ by customer class. EIA’s Energy Explained page gives 2025 US averages of 17.30 cents per kWh residential, 13.41 commercial and 8.62 industrial. It says the industrial price is generally close to the wholesale price.
Wholesale prices also change by hour. EIA reported on 7 April 2017 that in March, CAISO system average hourly prices from 8:00 a.m. to 2:00 p.m. were frequently at or below 0 USD per MWh. That is one market and one year. Still, it shows why a flat solar cost meets a moving price.
Tariff design matters too. NREL (renamed NLR in December 2025) says, in a 2015 study (NREL/TP-6A20-64850), that utilities were considering ways to recover fixed costs from residential PV customers. These included fixed charge increases, minimum bills and demand rates. Solar does not avoid a fixed charge. So the avoided energy charge can sit well below the average price per kWh.
How do you test grid parity?
Work out the solar cost per kWh, level the grid value over the same energy, and compare. Parity holds when the grid value is at or above the cost.
- Find the solar cost per kWh in real money. Take the installed price plus the present value of O&M, then divide by the present value of energy. See LCOE.
- Choose one grid basis from the table. Year-1 value per kWh = on-site share × avoided charge + (1 − share) × export price.
- Choose a real yearly rise for that value. Zero is a valid case. Keep real with real. SAM’s help says: "Never compare a real LCOE of one alternative with a nominal LCOE of another."
- Level the value. Weight each year’s value by that year’s discounted energy. With no rise it equals the year-1 value. A rise lifts it.
- Compare the levelised value with the cost. This is the same test as NPV at or above zero, before tax, at the same rate. NPV = (levelised value − LCOE) × present value of energy.
- Find the break-even. The year-1 value you need is the cost divided by the levelising factor. The break-even installed price is the price where value and cost are equal.
For the rise, see utility rate escalation.
Worked example: one 8 kW system, four grid prices
On example inputs the system costs 0.155 USD per kWh. It meets parity against the all-in average only. The break-even installed price ranges from 0.88 to 3.78 USD per W. The price paid is 2.60 USD per W.
| Input (example) | Value |
|---|---|
| System and price | 8 kW dc at 2.60 USD per W = 20,800 USD |
| O&M | 15 USD per kW per year = 120 USD per year |
| Output | 1,350 kWh per kW in year 1 (10,800 kWh), falling 0.5% a year, 25 years |
| Basis | Real money, 5% real discount rate, year-end flows, before tax, incentives and financing |
| Present values | Costs 22,491 USD, energy 145,207 kWh, so LCOE 0.155 USD per kWh |
| Blend | 60% of output used on site at the avoided charge, 40% exported at 0.05 USD per kWh |
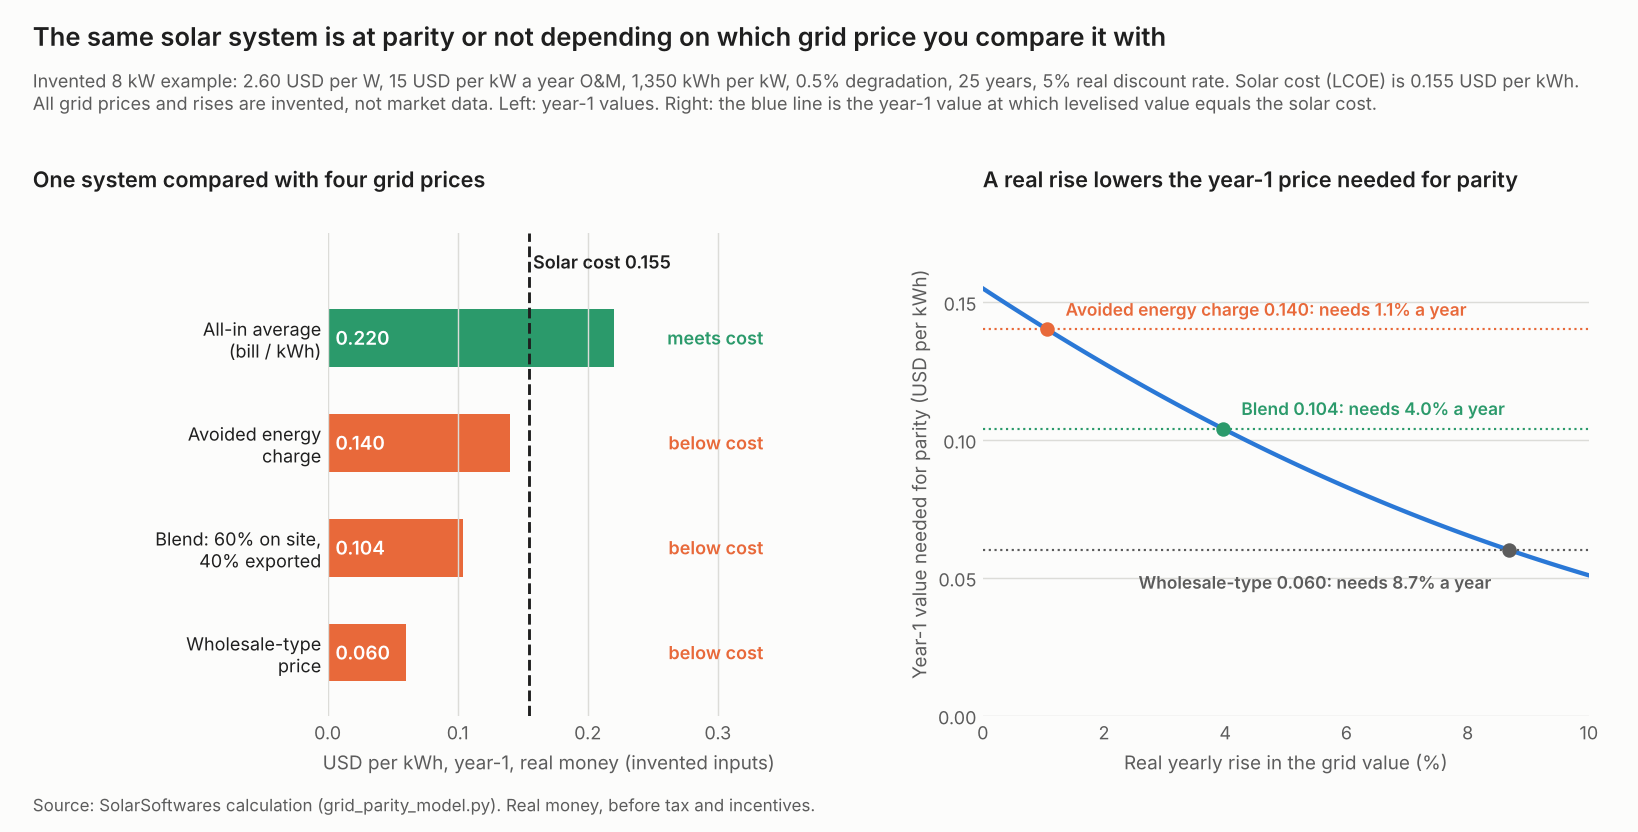
Figure 1. One example system meets parity against the 0.220 all-in average and falls short against 0.140, 0.104 and 0.060.
| Grid basis (example) | Year-1 value (USD per kWh) | Gap to cost (USD per kWh) | Parity? | Break-even installed price (USD per W) |
|---|---|---|---|---|
| All-in average | 0.220 | +0.065 | Yes | 3.78 |
| Avoided energy charge | 0.140 | minus 0.015 | No | 2.33 |
| Blend, 60% on site | 0.104 | minus 0.051 | No | 1.68 |
| Wholesale-type | 0.060 | minus 0.095 | No | 0.88 |
The 0.220 all-in average sits above the EIA US residential average of 0.173 USD, so treat it as a high case. It passes with room to spare. The avoided charge misses by 0.015 USD. Its break-even installed price of 2.33 USD per W is 0.27 below the 2.60 paid.
A real rise in the grid value changes that. A rise helps the avoided charge sooner than the blend. The levelising factor is the levelised value divided by the year-1 value. The table shows three real rises.
| Real rise a year | Levelising factor (year-1 value needed, USD per kWh) | Avoided charge 0.140: levelised, gap, parity | Blend 0.104: levelised, parity |
|---|---|---|---|
| 0% | 1.000 (needs 0.155) | 0.140, minus 0.015, No | 0.104, No |
| 1% | 1.099 (needs 0.141) | 0.154, minus 0.001, No | 0.114, No |
| 2% | 1.213 (needs 0.128) | 0.170, +0.015, Yes | 0.126, No |
The exact real rise that reaches parity is 1.1% for the avoided charge. It is 4.0% for the blend and 8.7% for the wholesale-type price. At 1% the avoided charge misses by only 0.001 USD.
A parity year needs two paths: the real rise in grid value and the real change in installed price. The table below buys the system in year n. The value is the avoided charge or the blend. It shows the first year that passes. A rise in the grid value or a fall in the installed price brings parity sooner.
| Real rise a year | Installed price change a year | Avoided charge 0.140 | Blend 0.104 |
|---|---|---|---|
| 0% | 0% | Not within 80 years | Not within 80 years |
| 0% | minus 2% | Year 6 | Year 22 |
| 1% | 0% | Year 1 | Year 31 |
| 1% | minus 2% | Year 1 | Year 11 |
Year 0 is today and Year 1 is buying one year from today. At a 1% rise the 0.140 avoided charge reaches about 0.1414 by Year 1, just above the 0.141 needed, so Year 1 passes although today misses. "Not within 80 years" means the test never passed in the 80 years we searched. The same system gives a first parity year of 1 or 31, depending on the basis and the paths.
Grid parity calculator
The presets reproduce the tables above. It is a design aid, not financial advice.
How solar software handles grid parity
Only Aurora’s and SAM’s pages state the comparison with a utility or retail rate. HelioScope and PVsyst report an LCOE without that comparison, and Energy Toolbase reports a net lifetime figure it calls LCOE. The table lists what five company pages say, checked in October 2026.
| Software | Reports LCOE? | Page states a grid or utility-rate comparison? |
|---|---|---|
| Aurora Solar | Yes | Yes |
| HelioScope | Yes | Not stated |
| SAM | Yes | Yes |
| PVsyst | Yes | Not stated |
| Energy Toolbase | Net lifetime metric | Not stated |
Not stated means the page we read does not say. Yes means it does. What each page says:
- Aurora Solar: Page read: Aurora help, Financial analysis overview, no date shown. Its LCOE includes performance-based incentives. The formula printed shows no discounting term, so it is not the levelised test above. The page says: "When the LCOE is lower than the customer’s utility rate, solar is generating electricity more cheaply than the grid."
- HelioScope: Lists Levelized Cost of Energy under Financial Metrics. No parity statement on the page. It lists a Utility Cost Escalator and a Flat Rate input. Pages read: HelioScope Financial Modeling Glossary, no date shown.
- SAM: Pages read: SAM help, Levelized Cost of Energy, no date shown. It lists cash incentives among the benefits that lower the levelised cost. The page says: "To be economically viable, the project’s LCOE must be equal to or less than the average retail electric rate."
- PVsyst: States the LCOE formula used in PVsyst and a discount rate that is used in LCOE and NPV. No grid-price comparison on the pages read. Pages read: PVsyst help, installation and operating costs, and financial parameters, no date shown.
- Energy Toolbase: Calls its figure "the all-in average blended cost of solar energy over the project’s lifetime". No grid-price comparison on the page. Pages read: ETB help article on lifetime LCOE, no date shown.
None of the five pages read names a "grid parity" output. Definitions of LCOE differ. So a number from one tool does not compare with another. For tools that model LCOE, rate escalation and incentives, see the best solar financial modeling software.
Common mistakes with grid parity
FAQs
Has solar reached grid parity?
Sometimes, and there is no single global answer, because parity depends on the place, the customer and the price compared. In our example case, a 0.155 USD cost beats the 0.220 all-in average but not the 0.140 avoided charge. EIA’s 2025 US average residential price is 17.30 cents per kWh. Test your own tariff with the calculator and state the basis in the proposal.
Is grid parity the same as LCOE?
No. LCOE is the solar side, a cost per kWh. Grid parity compares that cost with a grid price. The LCOE page covers how the cost is built.
Does grid parity include subsidies?
Some definitions count subsidies and some do not. Wikipedia describes parity as the point where a source can be widely developed without subsidies or government support. SAM counts cash incentives in its levelised cost. Say which you use. See solar incentives and rebates.
Does parity mean the customer saves money?
Not by itself. In our model, parity means NPV is at or above zero at the chosen real rate, before tax. It says nothing about timing, financing or tax. It also depends on what exports earn.
Related terms
- LCOE: the levelised cost per kWh that parity tests.
- Net metering: a billing rule that sets what an exported kWh earns.
- Utility rate escalation: the assumed rise in the grid price.
- Solar incentives and rebates: benefits that change the cost side.
Next step: run your own tariff through the calculator, then compare tools that model LCOE and rate escalation in the best solar financial modeling software.
Sources
All sources checked October 2026. Quoted wording was re-opened on 30 October 2026.
- Definitions. Branker, Pathak and Pearce, "A review of solar photovoltaic levelized cost of electricity", Renewable and Sustainable Energy Reviews 15(9), 2011 (abstract on EconPapers). Wikipedia, Grid parity. Grist, Solar grid parity 101, 15 January 2012.
- Prices and tariffs. EIA Energy Explained, prices and factors affecting prices (2025 averages). EIA Today in Energy, 7 April 2017. NREL, Impact of Rate Design Alternatives on Residential Solar Customer Bills (2015).
- Software. Aurora. HelioScope. SAM. PVsyst costs and financial parameters. Energy Toolbase.
- Calculation. Worked-example inputs are our assumptions.
Last updated 30 October 2026. Next scheduled review: 30 January 2027.