Key takeaways
- This example’s 10 kW home (27,500 USD, cash) has a 25-year simple ROI of 150.0%. The same cash flows give an IRR of 8.3% and a payback of 11.0 years.
- ROI depends on the horizon. The same example system gives minus 9.8% at 10 years and 218.8% at 30 years.
- "Annual ROI" has three meanings. For the example home, 150.0% over 25 years is 6.0% a year divided, 3.7% compounded or 8.3% as IRR.
- One example 20% incentive gives the same 49,745 USD net gain but two ROIs. It is 207.3% as a cost cut and 168.6% as a gain.
- In the example 80% loan case, ROI on all cash paid out, interest included, is 68.6%. Counting only the cash paid at year 0 gives 545.7%, which hides the loan.
To find tools that show ROI, payback and IRR side by side, start with the best solar financial modeling software.
ROI at a glance
ROI answers one question: how much did we gain for each unit of cost? It does not say how fast or how sure.
| Item | Detail |
|---|---|
| Formula | ROI = (total gain minus total cost) ÷ total cost × 100. Some sources skip the subtraction, so the ratio of 2.50 in our example below reads as 250%, not 150%. |
| Unit and range | Percent over a stated horizon. Our example: 150.0% over 25 years. The sources cited print no solar benchmark. |
| Where it matters | Proposals, sales talks and commercial buyers who compare solar with other uses of cash. |
| Standard or rule | No single standard. HelioScope’s help (3 June 2025, as printed) and a general business glossary (undated) each give their own wording. |
| In software | Some tools report ROI. Others show payback, IRR and NPV only. See best solar financial modeling software. |
HelioScope’s help says "the ROI represents a ratio that compares the gain or loss from an investment compared to its cost". It states the gain as the final salvage value minus the initial cost, then divides by cost. A general business glossary at a-capp.msu.edu credits Investopedia and prints no date. It says "the benefit of an investment is divided by the cost of an investment". If benefit means gross gain, that gives 250% here, against 150% net. Always say which one you quote.
Why does ROI matter for installers?
Buyers often ask for ROI first. But it moves with the horizon, the cost basis and the financing. Two quotes for one system can show different ROI.
Aurora’s help says IRR and NPV are typically the primary metrics for commercial projects. For zero-down loans it says "the concept of a ‘return on investment’ does not apply in the traditional sense". A rep who cannot say what sits in the cost and the gain cannot defend the figure. For the full set of finance outputs, see financial modelling.
What goes into cost and gain for a solar proposal?
Cost is everything the owner pays. Gain is every dollar saved or received. Each item below changes ROI. Treat it the same way on every quote you compare.
| Item | Side | How to treat it |
|---|---|---|
| System price, adders, battery | Cost | Use the buyer’s price before incentives. See price per watt. |
| Incentives | Cost cut or gain | Choose one and label it. A University of Nebraska-Lincoln guide (January 2013) takes credits, grants and subsidies off the cost for simple payback. Aurora’s lifetime savings counts incentives received. See incentives and rebates. |
| Bill savings | Gain | kWh used on site × import rate, plus kWh exported × export rate. See bill offset and self-consumption. |
| Rate escalation | Gain, grows later years | Aurora’s analysis includes escalating utility rates. See utility rate escalation. |
| Degradation | Gain, shrinks later years | Aurora’s analysis includes panel degradation. See degradation rate. |
| O&M and replacements | Cost | Aurora counts ongoing O&M. Our example has a 2,000 USD inverter replacement (example) in year 13. See capex and opex. |
| Financing | Cost | Interest and fees are paid out. Aurora includes financing costs. See solar loan and dealer fee. |
| Tax and depreciation | Left out here | Our example is before tax. See MACRS depreciation. |
Under a lease or PPA the host pays little or no cash up front. So ROI on year-0 cash has nothing to divide by. See third-party ownership.
How do you calculate solar ROI?
Add every inflow, subtract every payment, then divide by the payments: ROI = (inflows minus outflows) ÷ outflows. Fix the horizon first.
- Set the horizon in years. Write it beside the result.
- Build yearly savings: output × (share used on site × import rate + exported share × export rate). Output falls by the degradation rate. The import rate rises by the escalation rate.
- Add any incentive. Count it either as a cost cut at year 0 or as a gain in the year received.
- Total the cash paid out: price, O&M, replacements and loan payments with interest.
- Compute ROI = (total inflows minus total cash out) ÷ total cash out.
- For a yearly figure, name the method. It can be ROI ÷ years, compounded ROI, which is (1 + ROI)^(1 ÷ years) minus 1, or IRR.
Compounding the ROI treats all the gain as arriving at the end of the horizon. IRR credits early savings, so it is higher here.
Worked example: one example 10 kW home
On example inputs, one cash purchase gives a 25-year ROI of 150.0%. Change only the horizon, escalation, incentive treatment or financing and it moves between 68.6% and 218.8%. A fixed model computes every figure, and the calculator reproduces them.
| Input (example) | Value |
|---|---|
| System | 10 kW (stated size) at 2.75 USD per W = 27,500 USD paid at year 0 |
| Output | 14,000 kWh in year 1, falling 0.5% a year |
| Tariff | 70% used on site at 0.20 USD per kWh, rising 3% a year. 30% exported at 0.07 USD, flat |
| Costs | No O&M. Inverter replacement 2,000 USD in year 13 |
| Basis | 25 years, year-end cash flows, nominal, no tax. NPV at 4% nominal |
Year-1 saving is 14,000 × (0.7 × 0.20 + 0.3 × 0.07) = 2,254 USD. The one-year formula gives 27,500 ÷ 2,254 = 12.2 years. Year by year, payback is 11.0 years. Over 25 years the savings total 73,745 USD. The cash paid out is 29,500 USD. The ratio is 2.50, so ROI is 150.0%. Net gain is 44,245 USD. On the 27,500 USD paid at year 0 alone, ROI is 160.9%.
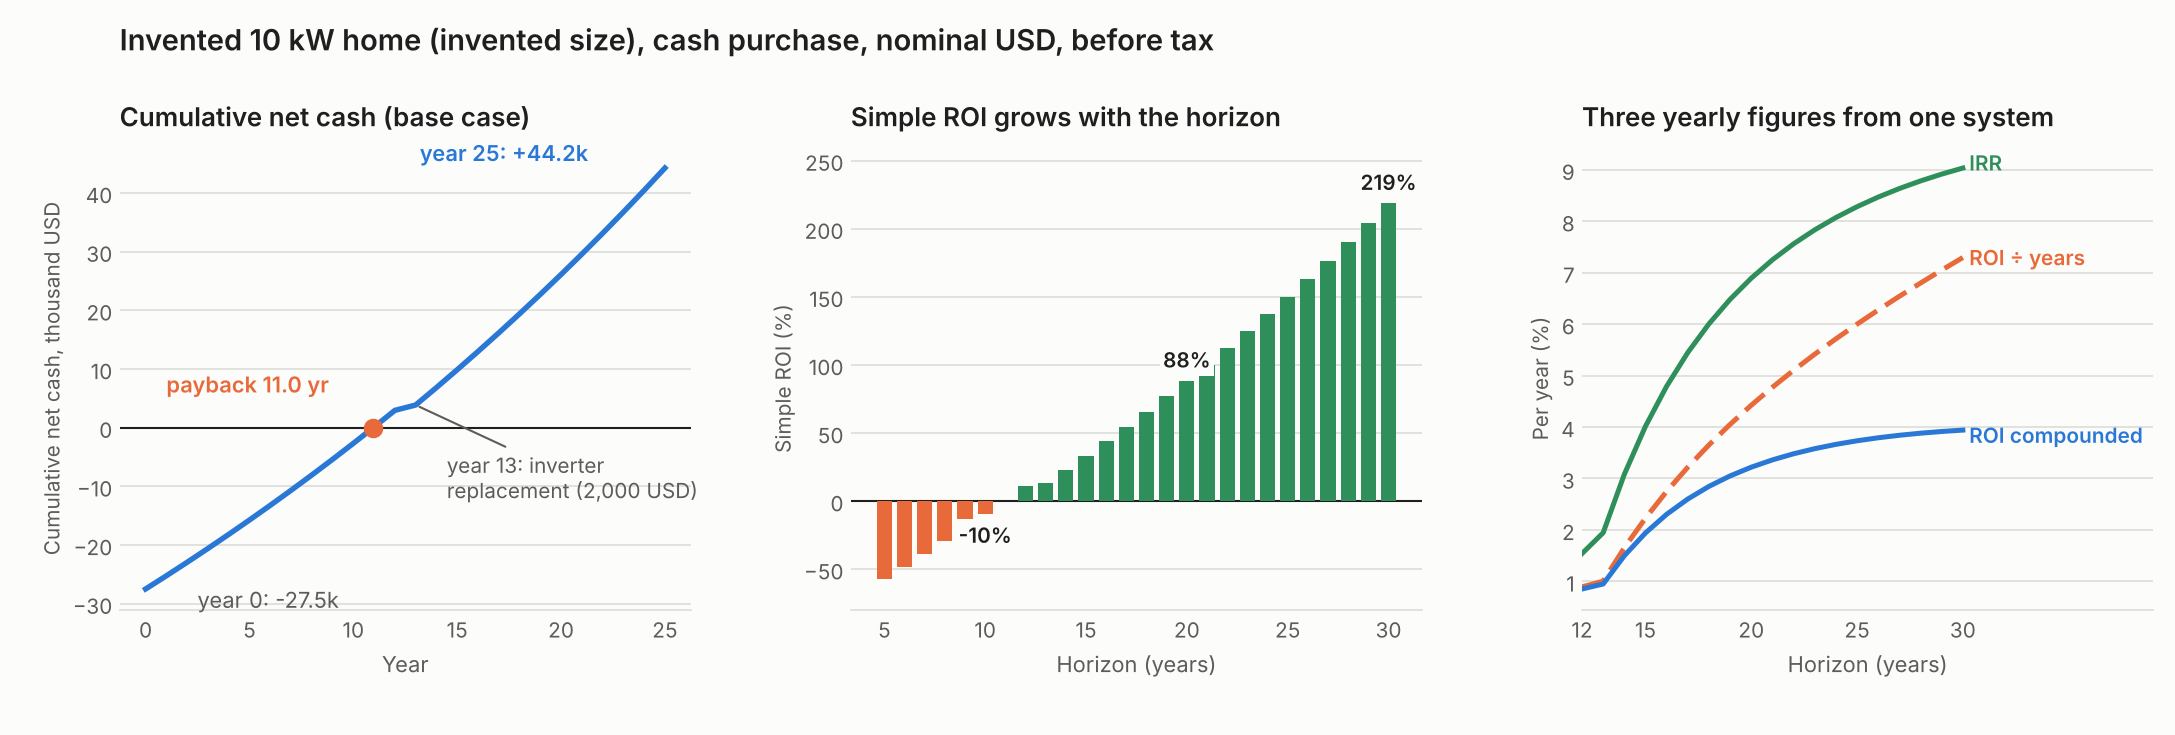
Figure 1. In this example home, simple ROI rises from minus 9.8% at 10 years to 218.8% at 30 years, while compounded ROI levels off near 4% a year.
Horizons below 13 years leave out the replacement. The 30-year row keeps the same inputs and adds no second replacement. The table shows how ROI and IRR change with the horizon.
| Horizon | Net gain (USD) | ROI | ROI per year: divided / compounded | IRR |
|---|---|---|---|---|
| 10 years | -2,682 | -9.8% | -1.0% / -1.0% | -1.8% |
| 15 years | 9,867 | 33.4% | 2.2% / 1.9% | 4.0% |
| 20 years | 26,101 | 88.5% | 4.4% / 3.2% | 6.9% |
| 25 years | 44,245 | 150.0% | 6.0% / 3.7% | 8.3% |
| 30 years | 64,553 | 218.8% | 7.3% / 3.9% | 9.0% |
Now change one input at a time over 25 years.
| Case (example) | Net gain (USD) | ROI | IRR | Payback (years) |
|---|---|---|---|---|
| Base case | 44,245 | 150.0% | 8.3% | 11.0 |
| Escalation 0% a year | 23,595 | 80.0% | 5.6% | 13.5 |
| Escalation 5% a year | 64,476 | 218.6% | 10.1% | 10.2 |
| Degradation 0% a year | 49,310 | 167.2% | 8.8% | 10.7 |
| Degradation 1% a year | 39,571 | 134.1% | 7.8% | 11.2 |
| 20% incentive (5,500 USD) cuts year-0 cash | 49,745 | 207.3% | 10.9% | 9.0 |
| Same incentive counted as a gain in year 1 | 49,745 | 168.6% | 10.6% | 9.0 |
| 80% loan at 7%, 15 annual payments | 30,013 | 68.6% | 9.7% | 16.4 |
The incentive rows differ only in bookkeeping. The net gain is identical. But the cost-cut view shrinks the denominator from 29,500 to 24,000 USD. IRR differs because the timing differs.
In the loan row, 22,000 USD is borrowed at an example 7%. The 15 payments of 2,415 USD carry 14,232 USD of interest. Cash paid out rises to 43,732 USD, so ROI falls to 68.6%. Only 5,500 USD is paid at year 0, so ROI on that cash is 545.7%. Net cash is negative in years 1 to 4 and again in year 13. A scan from minus 90% to 300% found only one IRR, 9.7%.
How do ROI, payback, IRR and NPV differ?
Each measure answers a different question about the same cash flows. ROI sizes the total gain. Payback times the recovery. IRR gives a yearly rate. NPV values the gain at a chosen discount rate. LCOE prices each kWh and is not a return.
| Measure | Question | Example base home | What it ignores |
|---|---|---|---|
| ROI | How much net gain per unit of cost? | 150.0% over 25 years | When the cash arrives. Changes with the horizon |
| Payback | When is the cost repaid? | 11.0 years | Everything after the payback year |
| IRR | What yearly rate do the flows earn? | 8.3% | Size. Can have several roots |
| NPV | What is the gain worth at the discount rate? | 15,400 USD at 4% nominal | Needs a discount rate |
The abstract of NREL’s 2011 report TP-6A20-52197 says different metrics frequently show different price thresholds. It says parameters such as financing terms can have a "significant impact on some metrics" and "minimal impact" on others, such as simple payback. Show more than one metric. (The US Department of Energy renamed NREL the National Laboratory of the Rockies on 1 December 2025.)
Solar ROI calculator
The presets reproduce the tables above. The calculator warns about bad inputs instead of showing a wrong number. It is a design aid, not financial advice.
How solar software handles ROI
Only one of the five company pages states an ROI method, and that is HelioScope’s help article. The tools were checked in October 2026 against pages that print the words below.
| Software | Reports ROI? | Method |
|---|---|---|
| Aurora Solar | Not mentioned | None |
| HelioScope | Partly | Net return ÷ cost × 100, as the page words it |
| PVsyst | Named | Not stated |
| OpenSolar | Not mentioned | None |
| EnergySage | Named | Not stated |
Not mentioned: the page names other metrics but not ROI. Named: the page lists ROI as a result. Partly: the page defines ROI but does not say where the tool shows it. Not stated: the page gives no ROI formula. What each company documents, with its source:
- Aurora Solar. The page does not mention an ROI field. It documents simple payback, NPV and IRR over a typical 25 years. Lifetime savings include incentives, financing, degradation, escalation and O&M, undiscounted. Source: Aurora help, financial analysis overview.
- HelioScope. A help article defines ROI beside NPV, IRR and payback. It does not say where the tool shows it. Source: HelioScope help, 3 June 2025 as printed.
- PVsyst. The overview says it provides financial results such as ROI, payback period and NPV. It gives no ROI definition on that page. Source: PVsyst help, economic evaluation.
- OpenSolar. The article lists payback, discounted payback and NPV among proposal metrics. It does not mention ROI. Source: OpenSolar support article on proposal metrics.
- EnergySage. Says payback and ROI calculations show when a cash purchase pays for itself and lifetime returns. Inputs include incentives, price rises and degradation. Source: EnergySage savings model page.
These lists compare more tools: best financial modelling software, best solar proposal software and software for C&I installers. To check real output against the proposal, see performance analytics and asset management software.
Common mistakes with ROI
FAQs
What is the formula for solar ROI?
ROI = (total gain minus total cost) ÷ total cost × 100. In our example home that is (73,745 minus 29,500) ÷ 29,500 = 150.0% over 25 years. State the horizon with the result.
What is a good ROI for solar?
A defensible ROI statement names its horizon, cost basis and incentive treatment, because no standard solar benchmark exists. The sources cited print none. Our example runs from 68.6% to 218.8% depending on horizon and financing. Compare quotes only at the same horizon and on the same cost basis.
How do I turn ROI into a yearly figure?
Three ways exist. Dividing by years gives 6.0% for the example home. Compounding gives 3.7%. IRR gives 8.3%. IRR respects the timing of cash, so use it when you need a rate.
Does ROI include the tax credit?
Only if your method says so, and only if the buyer can claim it. This example’s 20% incentive gives 207.3% as a cost cut and 168.6% as a gain. See incentives and rebates for rules.
Related terms
- Cash flow analysis: the year-by-year table behind ROI.
- Project finance model: debt-sized cash flows for larger projects.
- Feasibility study: an early go or no-go test of a project.
Next step: run your own cash flows through a tool from the best solar financial modelling software list.
Sources
All sources checked October 2026.
- Definitions. HelioScope help, financial metrics (3 June 2025 as printed).
- Definitions. General business glossary at a-capp.msu.edu (undated, credits Investopedia).
- Research. NREL, Impact of Different Economic Performance Metrics (2011, abstract page, checked 30 October 2026). Rename: US Department of Energy, 1 December 2025 (checked 30 October 2026).
- Context. University of Nebraska-Lincoln Extension, G2182 (January 2013). It does not use the term ROI. It sets simple payback with credits, grants and subsidies taken off cost.
- Software. Aurora. PVsyst. OpenSolar. EnergySage.
- Calculation. SolarSoftwares model. All inputs are this example’s assumptions.
Last updated 30 October 2026. Next scheduled review: 30 January 2027.