Key takeaways
- In the example, the widget says 8.31 kW at USD 24,923 (range USD 22,431 to 27,415). The final design is 6.97 kW at USD 24,007.
- The final price sits inside the range only because of a USD 2,400 adder. Without it, the price is USD 21,607, which is 13.3% below the widget price.
- A tariff assumption of 0.25 instead of 0.20 USD per kWh cuts the widget size by 20.0%.
- Of the five tools in the table, 3 document a visitor-facing estimate. Google’s Solar API is a data feed, not a widget.
- Before launch, run the widget on 10 past jobs and set the range from the misses.
To embed an instant estimate widget and route its leads, see the best solar lead generation software.
Instant estimate at a glance
An instant estimate answers "roughly what size and price?" in seconds. It does not answer "what will you install?".
| Item | Detail |
|---|---|
| Formula (simplest version) | Annual kWh = bill ÷ tariff. Size (kW) = annual kWh × share to cover ÷ yield (kWh per kW). Price = size × 1,000 × price per watt, shown as a range. |
| Inputs | An address, a bill or kWh, and often roof, home and contact details. |
| Outputs | System size, a price or range, sometimes a 3D view or a savings line. Each tool differs. |
| Standard or rule | None. Each company and installer sets the method. |
| In software | Lead-capture widgets inside design and CRM tools, plus data feeds that supply roof and sun data. |
Why do instant estimates matter for installers?
They move the first price conversation to before a call. Aurora’s page claims that gated flows, where contact details come before results, generally convert better but can bring lower-quality leads. That is a company claim, so test it on your own leads. The range should come from your past jobs, as the checklist below shows. See lead management for what happens next.
How does an instant estimate work?
It converts the visitor’s inputs into annual kWh, divides by a yield for a size, and multiplies by a price per watt. Tools that place panels on a modelled roof add a design step. OpenSolar’s page describes auto-design templates.
- Find the building from the address. Some tools use roof data, some ask the visitor to draw the roof.
- Get annual kWh. Divide a bill by a tariff, or take kWh the visitor enters.
- Size the system: kWh × share to cover ÷ yield.
- Cap the size at what the roof holds, if roof data exists.
- Price it from your price book, then show a range.
- Capture the contact details and pass the lead to your CRM.
Where does the data come from?
Four inputs feed the number: the roof, the sun, the usage and your prices. The company pages read name few outside sources, so confirm the data with each company.
| Input | Data used | What the page read says |
|---|---|---|
| Roof and building | Imagery, roof data or a drawn outline. | Google Solar API building insights returns roof segment size, orientation and sunniness quantiles for one building per request. It returns a 404 error if imagery does not meet the requested quality. The coverage page calls its map an approximation. Pixel sizes are in aerial imagery. |
| Sun and yield | A weather dataset run through a production model. | The NLR (formerly NREL) PVWatts v8 API takes system capacity, module type, losses, array type, tilt and azimuth. Its dataset choices are NSRDB gridded TMY data (the default), TMY2 and TMY3 station data, and international station data. The page gives no default for losses. See NSRDB and system losses. |
| Usage | The visitor’s bill or kWh. | Aurora’s page requires an address and an average energy bill. OpenSolar lets the installer offer five consumption options. See consumption profile and tariff databases. |
| Price | The installer’s templates or price book. | OpenSolar prices from the auto-design template assigned to each system type, and can show a range. See adders. |
Worked example: ballpark against final design
A visitor enters a 180 USD monthly bill. The widget treats it all as energy. All numbers are example, including the tariff, yields and prices.
| Item (example) | Widget | Final design |
|---|---|---|
| Bill used | 180 USD, all energy | 160 USD energy, 20 USD fixed charges |
| Annual use at 0.20 USD per kWh | 10,800 kWh | 9,600 kWh |
| Yield | 1,300 kWh per kW | 1,180 kWh per kW after shade |
| Size needed for 100% of use | 8.31 kW | 8.14 kW |
| Roof limit | Not checked | 17 modules × 410 W = 6.97 kW |
| System size | 8.31 kW | 6.97 kW |
| Share of use covered | 100% (assumed) | 85.7% |
| Price per watt | 3.00 USD | 3.10 USD |
| Adders | None | 2,400 USD |
| Price | USD 24,923 (range USD 22,431 to 27,415) | USD 24,007 |
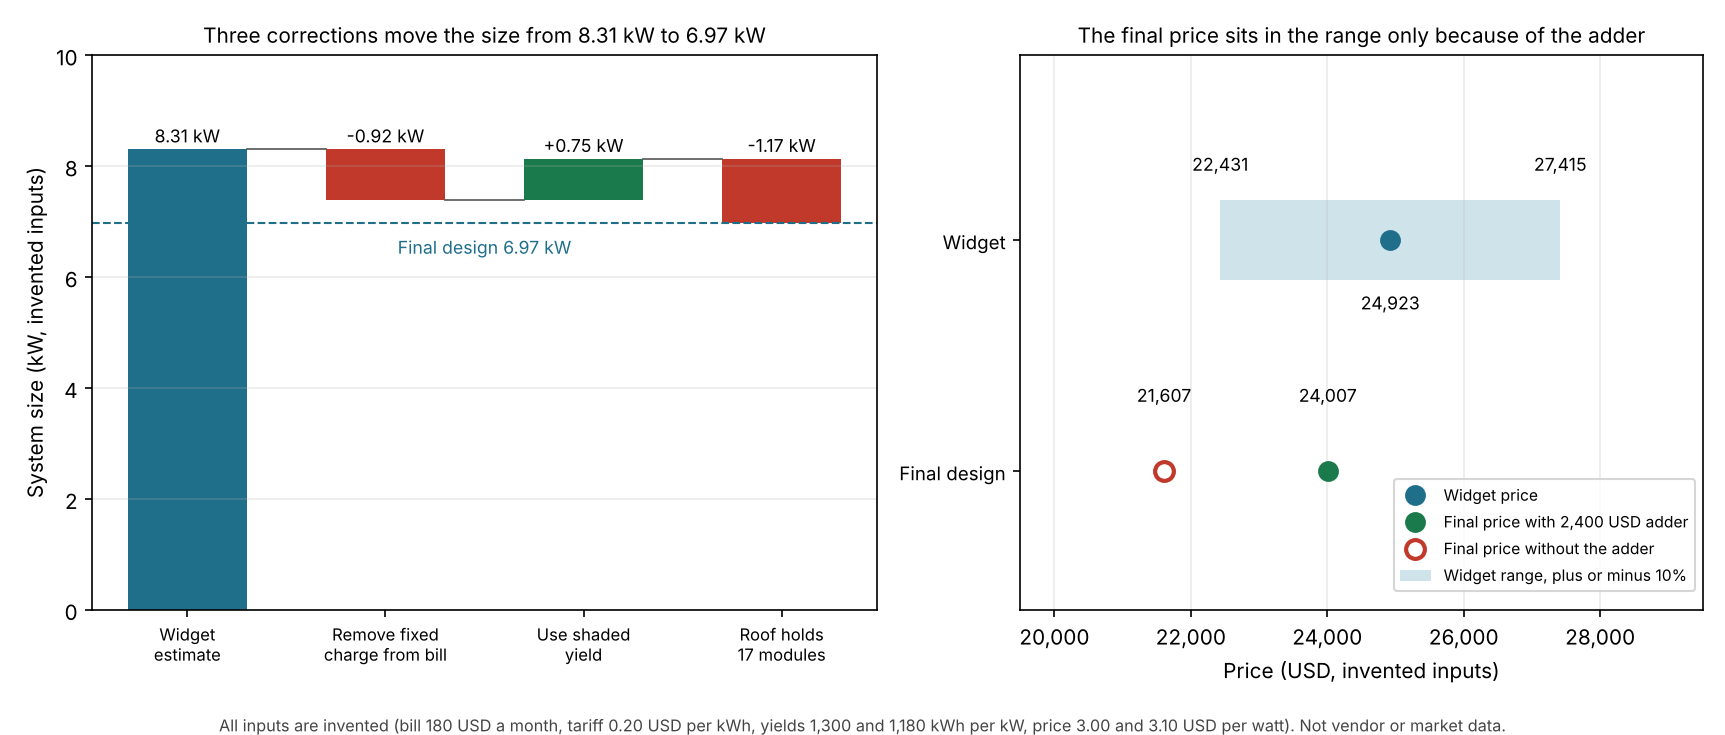
Figure 1. In this example, size falls 16.1% from 8.31 to 6.97 kW. The final price sits inside the range only because of a USD 2,400 adder.
The size fell for three reasons:
- Fixed charges removed: cut it by 0.92 kW.
- Shade: raised it by 0.75 kW.
- Roof limit: cut it by 1.17 kW.
The price looked close because two errors offset each other. A higher price per watt (3.10 against 3.00 USD) and the 2,400 USD adder pushed it up. The roof-limited size of 6.97 kW pulled it down.
Why does the ballpark miss the final design?
The formula sees only what the visitor typed and what the tool assumed. Each assumption moves the size in proportion, as the table shows.
| One change to the widget inputs (example) | Widget size | Change |
|---|---|---|
| Base: 180 USD bill, 0.20 USD per kWh, 100% share, 1,300 kWh per kW | 8.31 kW | 0.0% |
| Tariff assumed 0.25 USD per kWh | 6.65 kW | -20.0% |
| Bill holds 20 USD fixed charges (160 USD energy) | 7.38 kW | -11.1% |
| Yield 1,180 kWh per kW (more shade) | 9.15 kW | +10.2% |
| Cover 80% of use | 6.65 kW | -20.0% |
Shade lowers yield, so the same offset needs a bigger array. The roof then caps it. A widget can also miss:
- Roof facts: obstructions and setbacks. See setbacks.
- Real use: a bill is not 12 months of kWh. See consumption profile.
- Site-specific adders: a panel upgrade, trenching or a battery.
Ballpark against final design calculator
Enter the widget’s assumptions on the left and what the final design found on the right. The tool shows the size and price variance. The starting values are the example.
What should an installer check before going live?
Test the widget against jobs you have already priced, then set the range and the wording from those misses. Start with the past-job test.
| Check | How |
|---|---|
| 1. Past-job test | Run the address and bill of 10 recent jobs. Record variance = final ÷ widget − 1 for size and price. Set the range from those misses and show a range, not one figure. OpenSolar’s page lets you add a fixed amount or percentage either side of the price. |
| 2. Service area | Aurora’s page checks the address against your service regions and removes others before contact details. Google’s coverage page calls its map an approximation, and building insights returns a 404 when imagery is not good enough, so test addresses near the edge of your area. |
| 3. Price book match | Keep templates and adders current. OpenSolar’s page says a template of the wrong system type gives incorrect results. |
| 4. What the visitor sees | Decide on size, price and savings. A savings line needs a stated basis, so check your local rules on wording. |
| 5. Gate position | Try contact details before and after results. Aurora’s page offers both. |
| 6. Hand-off | Check the lead arrives with its estimate data and an owner. Aurora and OpenSolar pages describe leads created in their own tools. Then send a web proposal from the final design. |
How solar software handles instant estimates
Of the five tools in the table, Aurora Solar, OpenSolar and Fuzen document a visitor-facing estimate. Google’s Solar API is a data feed only, and Easy PV is not rated. The table shows what the visitor enters and sees, as each company page said in October 2026.
| Software | Estimate widget documented? | Visitor enters | Visitor sees | Page read |
|---|---|---|---|---|
| Aurora Solar | Yes. Lead Capture AI. | Address and average energy bill. Optional bill upload and qualification answers. | A 3D model on their home and a savings estimate, by default. Price not mentioned. Size and annual production reach you through the Leads API. | Two Aurora blog posts, no date printed. |
| OpenSolar | Yes. AI Lead Generation. | Address, consumption and email. Consumption can be a low, medium or high level, annual kWh or annual dollars. | Solar, battery or both options from your templates, with pricing, optionally as a range. Size and savings: Not stated. | Support article, last updated 26 August 2026. Product page, modified 3 June 2026. |
| Fuzen (SolarFlow CRM) | Yes. Calculator widget, India-market defaults. | Monthly bill by slider, optional roof area, then contact details. | System size, total cost, a subsidy line, net cost, monthly savings and payback. The page does not say how a bill becomes a size. | Fuzen post, 25 June 2026. |
| Easy PV | Not stated. Names an Instant Estimate Tool (Beta). | Not stated | Whether the property suits solar and an indicative price. | Help page, an older revision with placeholder text, no date. |
| Google Solar API | Partly. A data feed, not a widget. | A location, from your own code. | Roof segments, panel configurations and yearly energy figures for one building, which you must wrap in your own price and tariff logic. | Building insights page, updated October 2026. |
The table lists what each page said. It is not a ranking. Not stated: the company page we cite does not say. Partly: the product supplies only part of the job. Easy PV’s row is not rated because the copy we read is an older revision with placeholder text. Ranked options for capturing and routing these leads are in our guide to the best solar lead generation software.
Common mistakes with instant estimates
FAQs
Is an instant estimate the same as a quote or proposal?
No. An instant estimate is a ballpark from a few inputs. A proposal comes from a finished design with equipment, adders and terms. See solar proposal software.
Does the visitor need to enter a bill?
Not always. Aurora’s page needs an address and an average energy bill to build the 3D model. OpenSolar’s page offers five consumption options, including three estimate levels, so the form need not ask for a bill. The installer picks the default option.
Does it work outside the US?
Yes, in part. Google says the Solar API covers hundreds of millions of buildings worldwide, but its map is approximate. PVWatts offers an international station dataset, and Fuzen’s widget uses India-market defaults. Coverage varies by area.
Should the widget show a price?
It can, and a range is one option. OpenSolar’s page lets you display a price as a range, and its product page says you can keep exact equipment and pricing hidden. Test both against your own lead quality.
Related terms
- Lead management: how each enquiry is captured, assigned and followed up.
- Interactive web proposal: a proposal the customer opens through a link.
- Aerial imagery: the overhead pictures that roofs are traced on.
- Adders: priced extras on top of the base price per watt.
- Consumption profile: a site’s electricity use over time.
Next step: run the past-job test on 10 recent jobs, then compare lead capture tools in the best solar lead generation software list.
Sources
- Aurora blog: Lead Capture AI customizations (no date printed, checked October 2026).
- Aurora blog: qualifying leads and the Leads API (no date printed, checked October 2026).
- OpenSolar support: AI Lead Generation (last updated 26 August 2026, checked October 2026).
- OpenSolar: AI Lead Gen (last modified 3 June 2026 per page metadata, checked October 2026).
- Fuzen: solar calculator for website (25 June 2026, checked October 2026).
- Easy PV help: embedding the instant estimate tool (older revision, no date, checked October 2026).
- Google Solar API: building insights (updated October 2026, checked October 2026).
- Google Solar API: coverage (updated October 2026, checked October 2026).
- NLR (formerly NREL) PVWatts v8 API (no date printed, link moved to the nlr.gov domain after the lab’s 2025 rename, re-verified November 2026).
Last updated 30 October 2026. Next scheduled review: 30 January 2027.