Key takeaways
- Debt is the lowest-year cash flow divided by the minimum DSCR, times the annuity factor. The lowest result across all limits wins.
- This example’s 1,200 kWdc rooftop sizes at 857,546 USD of debt, 59.6% of capex. The P90 limit sets it, while P50 alone would allow 883,292 USD.
- One example 36,000 USD inverter replacement in year 11 cuts DSCR-based debt capacity by 13.1% on P50 and 16.1% on P90.
- That loan has a P50 DSCR of 1.34 in its weakest year and 1.59 on average, so quote the lowest year.
- A year-1 DSCR of 1.54 does not mean revenue can fall 35.1%. With fixed O&M it can fall 31.6%, and in year 11 (P50 case) only 17.9%.
To size debt in a project finance tool, see the best solar financial modeling software list.
Debt sizing and DSCR at a glance
It answers one lender question: how big a loan can this cash flow carry with room to spare? That room to spare is the coverage ratio.
| Item | Detail |
|---|---|
| Formula | DSCR = CFADS ÷ scheduled debt service. Debt = level payment × annuity factor. |
| Unit and range | A ratio. Below 1.00 cash does not cover payments. The lender sets the minimum. |
| Where it matters | Loan term sheets, developer bids, project sales. |
| Standard or rule | No solar-specific standard found. The loan agreement defines CFADS and DSCR. |
| In software | Of the three tools checked, SAM sizes debt from a DSCR input. Two do not document it. |
Why do debt sizing and DSCR matter for installers and developers?
Debt size sets how much equity a project needs and how low a price you can bid. For lease and PPA structures, see third-party ownership. The full cash waterfall, reserves and lock-up sit on the project finance model page.
How is DSCR calculated?
DSCR is cash flow available for debt service (CFADS) divided by debt service in the same period. Debt service is the scheduled interest plus scheduled principal.
Forvis Mazars writes it as "DSCR = CFADS ÷ Debt Service". It says only scheduled payments count. Cash sweeps are left out. SAM’s help page defines it as the ratio of "cash available for debt service (CAFDS)" to "the total debt payment in that year". A ratio of 1.00 is break-even. The British Business Bank’s CFADS page says a ratio below one means a business cannot service its debt.
Three choices change the answer. Say which one you used when you quote a DSCR.
- What is in CFADS. Forvis Mazars describes it as cash after operating costs and taxes, before debt payments. The Renewables Valuation Institute (RVI) CFADS page lists operating expenses, taxes and capital expenditure as deductions. The loan agreement decides.
- Which period. An annual DSCR adds up CFADS and debt service over 12 months. Per Forvis Mazars, that smooths short swings.
- Which figure. RVI’s DSCR page speaks of minimum DSCR targets, so quote the lowest year as well as the average. The two are different numbers.
For the cash table behind CFADS, see cash flow analysis and capex and opex.
How is debt sized from cash flow?
Divide the weakest year’s CFADS by the minimum DSCR to get the largest level payment. Multiply by the annuity factor to get the loan. Then pick the lowest result across all limits.
This is the level-payment method. In a sculpted loan, each period’s debt service is that period’s CFADS divided by the target DSCR (RVI).
- Forecast CFADS for each loan year in a P50 case and a downside case such as P90. See P50, P90 and P99.
- Set a minimum DSCR for each case. In RVI’s P50 and P99 case study, the P50 case uses a minimum of 1.20 and the P99 case 1.00.
- For each case, level payment = lowest CFADS ÷ minimum DSCR.
- Debt = payment × annuity factor. The factor is (1 − (1 + r)−n) ÷ r, for rate r and n years.
- Add any other limit, such as a cap on debt as a share of capex.
- Take the lowest debt. Then check DSCR in each year of the loan.
RVI (8 August 2025) says lenders work out debt capacity under both P50 and downside cases, and the lower one binds. Its examples use P99. We use P90 and a flat cut to energy, which is a simplification. A sculpted loan follows each year’s CFADS instead of one level payment. The project finance model page covers it.
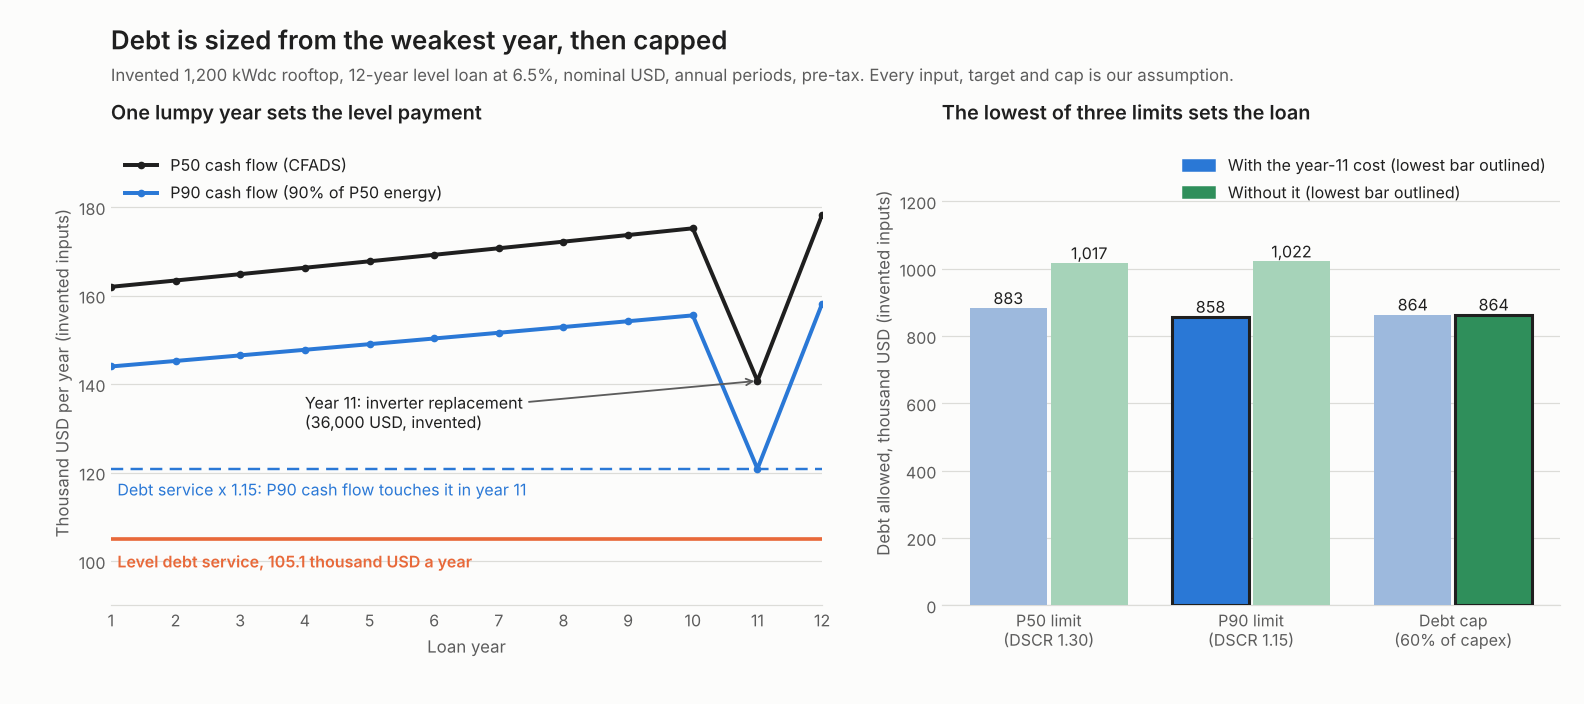
Figure 1. In our example case, a 36,000 USD year-11 cost cuts P50 debt capacity from 1,017 to 883 thousand USD. Then the P90 limit sets the loan.
Worked example: a 1,200 kWdc commercial rooftop
All inputs are example for teaching. The loan has level annual payments, due at each year end.
| Input (all our assumptions) | Value |
|---|---|
| Size and capex | 1,200 kWdc at 1.20 USD per W = 1,440,000 USD |
| Energy | P50: 1,500 kWh per kWdc in year 1, falling 0.5% a year. P90 case: 90% of P50 in every year |
| Price | 0.10 USD per kWh in year 1, rising 1.5% a year |
| O&M | 15 USD per kWdc in year 1 (18,000 USD), rising 2% a year |
| One-off cost | 36,000 USD in year 11 (inverter replacement), deducted from that year’s CFADS |
| Loan | 12 years, 6.5% a year, annuity factor 8.1587 |
| Limits | Minimum DSCR 1.30 on P50 and 1.15 on P90. Debt no more than 60% of capex |
| Left out | Tax, incentives, fees, reserve account, construction interest, insurance, land |
Year-1 revenue is 180,000 USD. Less 18,000 USD O&M, year-1 CFADS is 162,000 USD. We assume CFADS here is before tax. Year 11 is the weakest year in both cases. P50 CFADS is 140,742 USD there and P90 is 120,874 USD. See O&M for replacement planning.
With the year-11 cost, the P90 limit sets the loan. Without it, the 60% debt cap does. The table shows each limit.
| Limit | Largest level payment (USD) | Debt allowed (USD) | Debt allowed without the year-11 cost (USD) |
|---|---|---|---|
| P50 DSCR 1.30 | 108,263 | 883,292 | 1,016,703 |
| P90 DSCR 1.15 | 105,108 | 857,546 | 1,021,614 |
| Debt cap, 60% of capex | 105,899 | 864,000 | 864,000 |
| Loan sized (lowest) | 105,108 | 857,546 (P90 limit) | 864,000 (debt cap) |
Equity at close is 1,440,000 less 857,546, which is 582,454 USD. The three limits sit within about 3% of each other, so small input changes move the binding one. P90 sets the loan, 6,454 USD under the cap.
Now test the sized loan. Debt service is fixed at 105,108 USD a year.
| Loan year | P50 DSCR | P90 DSCR |
|---|---|---|
| 1 | 1.54 | 1.37 |
| 5 | 1.60 | 1.42 |
| 10 | 1.67 | 1.48 |
| 11 | 1.34 | 1.15 |
| 12 | 1.70 | 1.51 |
| Lowest / average, all 12 years | 1.34 / 1.59 | 1.15 / 1.41 |
The P90 DSCR hits its 1.15 minimum in year 11 and no other year, which is why that year binds. To see how far revenue can fall in a year before DSCR reaches 1.00, use (CFADS − debt service) ÷ revenue. In year 1 that is (162,000 − 105,108) ÷ 180,000 = 31.6%. The shortcut 1 − 1 ÷ 1.54 gives 35.1%, which is the fall in CFADS, not in revenue. In year 11 (P50 case) revenue can fall 17.9%.
Next, change one input at a time from the base case. The first four rows move the DSCR minimums and the interest rate.
| Input changed | Debt (USD) | Limit that binds |
|---|---|---|
| Base case | 857,546 | P90 DSCR |
| P50 minimum DSCR 1.20 | 857,546 | P90 DSCR |
| P50 minimum DSCR 1.40 | 820,199 | P50 DSCR |
| Interest 5.5% | 864,000 | Debt cap |
| Interest 7.5% | 813,039 | P90 DSCR |
The next three rows move the P90 energy cut and the loan tenor.
| Input changed | Debt (USD) | Limit that binds |
|---|---|---|
| P90 energy 85% of P50 | 787,067 | P90 DSCR |
| P90 energy 93% of P50 | 864,000 | Debt cap |
| Loan tenor 14 years | 864,000 | Debt cap |
A longer tenor adds debt only until another limit binds. These results hold for this example project, not as a rule.
Calculator: size a level loan from cash flow
Enter your own inputs. The defaults are the example above, and the calculator reproduces its tables.
If the calculator does not load, open the debt sizing calculator on its own page.
How solar software handles debt sizing and DSCR
Only SAM documents sizing debt from a DSCR. The pages for the other two of the three tools do not mention DSCR or debt sizing. Pages checked October 2026.
| Software | Sizes debt from a DSCR? |
|---|---|
| SAM | Yes |
| HelioScope | Not stated |
| Energy Toolbase (ETB Developer) | Not stated |
Not stated means the page we cite does not say.
- SAM. Debt can be sized from one DSCR input, with inputs to limit the debt fraction. No separate P50 and P90 limits on these pages. Detail is on the project finance model page. Page read: SAM help, Debt and Equity, undated. PySAM 8.0.0 Singleowner docs.
- HelioScope. The glossary page covers a loan financing step with a down payment and a term in months. DSCR is not mentioned. The Financials help category lists no debt-sizing article by title. Page read: HelioScope Financial Modeling Glossary, no date shown.
- Energy Toolbase (ETB Developer). Describes ETB Developer as solar and storage financial modelling and PPA financing quotes. Neither page mentions DSCR or debt sizing. Page read: Full product suite page (metadata: last modified 15 August 2025). PPA financing page (metadata: last modified 22 July 2025).
To compare tools that model project finance, see the best solar financial modeling software list.
Common mistakes with debt sizing and DSCR
FAQs
What DSCR do lenders require?
RVI’s DSCR page gives two illustrations, not a rule. A Spanish solar plant with a feed-in tariff might have a minimum of 1.30 on a P50 basis. A Finnish wind farm with high production uncertainty and no contracted offtake might have 1.70 or higher on P90. No single figure applies and no solar-specific standard was found, so check your term sheet.
Why size on P90 or P99 as well as P50?
A P50 case alone leaves the lender exposed if output falls short. RVI says lenders work out debt capacity under both cases and use the lower one. In our example, P90 set the loan, but at a 1.40 P50 minimum it would be P50.
What is the difference between DSCR sizing and a debt cap?
A debt cap limits debt to a share of capex, often called gearing or loan to cost. DSCR sizing limits it by cash flow. The loan is the lower of the two. If revenue is very high against costs, DSCR sizing alone can give a high debt share, so check the share.
What happens if DSCR falls below 1.00?
Cash flow no longer covers that year’s payment. The loan agreement says what happens next. RVI says a debt service reserve account releases cash when DSCR falls below 1. Forvis Mazars describes lock-up as stopping distributions to equity below a set level. Our example does not model a reserve.
Related terms
See project finance model for sculpting and the waterfall, financial modelling for model structure, and solar loan for the borrower side. For lease and PPA funding, see power purchase agreement.
Next step: for DSCR sizing alone, start with the SAM row above. For a full cash waterfall, use the best solar financial modeling software list.
Sources
- Renewables Valuation Institute: debt service coverage ratio, dated 01/31/2023 on the page (checked October 2026).
- Renewables Valuation Institute: P50 vs P99 in project finance, dated 08/08/2025 on the page (checked October 2026).
- Renewables Valuation Institute: debt sizing with target DSCR, sculpted repayment (checked 30 October 2026).
- Renewables Valuation Institute: CFADS, dated 01/12/2023 on the page, day and month order not stated (checked October 2026).
- Forvis Mazars: debt service coverage ratio, 24 September 2026 (checked October 2026).
- British Business Bank: what is CFADS, no date shown (checked October 2026).
- SAM help: Debt and Equity, no date shown, and PySAM 8.0.0 Singleowner documentation (checked October 2026).
- HelioScope: Financial Modeling Glossary and Financials help category, no date shown (checked October 2026).
- Energy Toolbase: full product suite and PPA financing in ETB Developer, dates from page metadata (checked October 2026).
Last updated 30 October 2026. Next scheduled review: 30 January 2027.