Key takeaways
- A microgrid can join or leave the grid and run alone for a set number of hours. Design shows how long, and at what fuel use.
- The worked example sizes a 150 kWdc array, a 50 kW generator and three batteries. Its inputs are invented or assumed, so every result is illustrative.
- In the stress week, the generator ran 100 of 168 hours with a 200 kWh battery and burned 636 L of diesel. Going from 100 to 400 kWh saved 80 L (12%).
- Over the typical year, the same change saved 12,248 L (69%). One week cannot size a battery.
- With the generator off, 47% to 53% of the stress-week load went unmet for every battery size. Even 400 kWh did not remove the need for a generator.
Few tools model solar, a battery and a generator together. For the closest list, see the best off-grid solar design software.
Microgrid design at a glance
| Item | Detail |
|---|---|
| Core question | What mix of solar, battery and generator can serve the load for the hours you need, and at what fuel use and renewable fraction? |
| Typical inputs | Hourly load, a list of critical loads, a weather file, the outage target in hours, equipment limits and a fuel curve. |
| Where it matters | Resilience quotes, remote sites, fuel budgets and talks with the utility. |
| Standard or rule | This page cites no single standard. The DOE definition above frames the term. Your utility and AHJ set the interconnection and protection rules. |
| In software | Hybrid-system optimisers such as HOMER Pro, stand-alone modules in yield tools, and spreadsheets or code for simple rules. |
Why microgrid design matters for installers
A microgrid is sold on keeping the lights on. The design must show for how long. It must show the fuel and the generator hours too.
A system that is too small leaves load unmet in the worst week. One that is too big wastes solar. In the example below, the 200 kWh battery already takes in the sunny-week surplus, so 400 kWh adds nothing.
What are the parts of a microgrid, and what are its modes?
A solar microgrid has sources, storage, a controller, loads and a switch. The switch can cut the site off from the grid (islanding). The same hardware runs in three modes.
- Solar and its inverters: the energy source. To see how it ties to the battery, read inverter and AC vs DC coupling.
- Battery: moves solar to the evening and covers short gaps. See battery storage design.
- Generator: fuel-fired backup for long, dull spells. It has a minimum load and a fuel curve.
- Controller: picks which source serves the load. It also manages the switch to island mode.
- Switch at the point of connection: a breaker or transfer switch that splits the site from the grid. The utility and an engineer set its protection. This page does not.
| Mode | What sets frequency | What drives the size |
|---|---|---|
| Grid-connected | The grid (NREL, 2019). | Bills, export limits, peak shaving, self-consumption. |
| Islanded for an outage | A grid-forming source (NREL, 2019). | Critical load and outage hours. See backup power for critical loads. |
| Permanently off-grid | A grid-forming source. NREL’s deck says a microgrid can be permanently isolated, for example at a remote site. | The whole load, all year. See off-grid system design. |
The off-grid page covers array and battery sizing for a site with no grid. This page covers sites with several sources, and the controls.
How do microgrid controls work?
A controller picks the source for each interval. Something in the island must also hold voltage and frequency steady.
- Dispatch: Idaho National Laboratory’s GridTechPedia says controllers optimise dispatch of generators, solar, wind and storage. HOMER Pro lists load following. Here generators make just enough power for the load. It also lists cycle charging. Here they make as much as they can and charge the battery. The example uses load following.
- Islanding: the same INL page says controllers island the microgrid on their own, then reconnect. NREL’s 2019 deck says transition time varies from 20 ms to 5 minutes.
- Grid-forming inverters: INL defines them as devices that set and hold grid frequency and voltage alone. Grid-following inverters need a grid reference. NREL’s 2019 deck lists generators and storage as able to grid-form and PV as unable. INL (2026) says grid-forming inverters began with batteries. Check each datasheet.
- Black start: an NREL paper (August 2023) defines a black-start resource. It is a generator that can start a grid with no outside voltage. It says synchronous generators have exclusively provided this. INL says grid-forming inverters can re-energise a grid. They may need extra sizing.
Hourly steps cannot show surges, protection or stability. An engineer must study those.
How do you size a microgrid?
Start with the load and the outage target. Then test the mix hour by hour, as the steps below do.
- Load: build an hourly profile and split out the critical load. See consumption load profile.
- Outage target: state how many hours the site must run islanded. Battery ride-through before solar is usable kWh divided by average load. In the example that is 5.1, 10.1 and 20.2 hours. Those are for 100, 200 and 400 kWh.
- Solar: size for the worst season, using a weather file such as a typical meteorological year.
- Battery power and energy: kW must cover the largest hourly gap the generator does not fill. kWh comes from the outage target and the energy a cloudy spell needs.
- Generator: rate it above peak load and check its minimum load. HOMER defines the minimum load ratio as the lowest load allowed, as a percent of rated capacity. Real sets and inverters are rated in kVA, so also check power factor and reactive power.
- Simulate: run every hour of the year (see 8,760-hour simulation). Report renewable fraction, unmet load, generator hours and fuel.
Worked example: a small clinic and school site
The example is a rule-based hourly dispatch for a week, run with three battery sizes. It follows simple rules and is not an optimiser. Every input below is assumed or example.
| Input | Value and basis |
|---|---|
| Weather | pvlib on the Greensboro, NC typical-year file (NREL TMY3 station 723170, shipped with pvlib). |
| Solar array | 150 kWdc at 35° tilt facing south, Perez model, 14% losses, 0.96 inverter efficiency, DC/AC ratio 1.2. |
| Load (example) | Weekday 522 kWh, weekend 355 kWh, peak 36 kW. The week totals 3,320 kWh, average 19.8 kW. |
| Battery (assumed) | 100, 200 or 400 kWh usable. 50 kW power. 90% round trip (NREL’s 2019 deck gives about 90% for storage). Starts the week at 20 kWh. |
| Generator (assumed) | 50 kW. Minimum load 30%, the value in HOMER’s manual example. |
| Fuel curve (assumed) | 8.48 L/h at 25 kW and 15.3 L/h at 50 kW, from a HOMER Pro 3.16 manual example. That gives 0.273 L/kWh and about 1.65 L/h at zero output. |
| Stress week | The Monday-to-Sunday week with the least solar in the file (from 25 December in its 2023 calendar), with 1,887 kWh of solar. |
| Sunny week | The week with the most solar, starting 17 April, with 5,964 kWh. |
| Solar and battery rules | Solar serves load first. Surplus charges the battery, then is curtailed. The battery covers a deficit. |
| Generator rules | If the battery cannot cover the deficit, the generator starts at no less than its minimum load. Extra output charges the battery. Steps are hourly, with no ramp limits. |
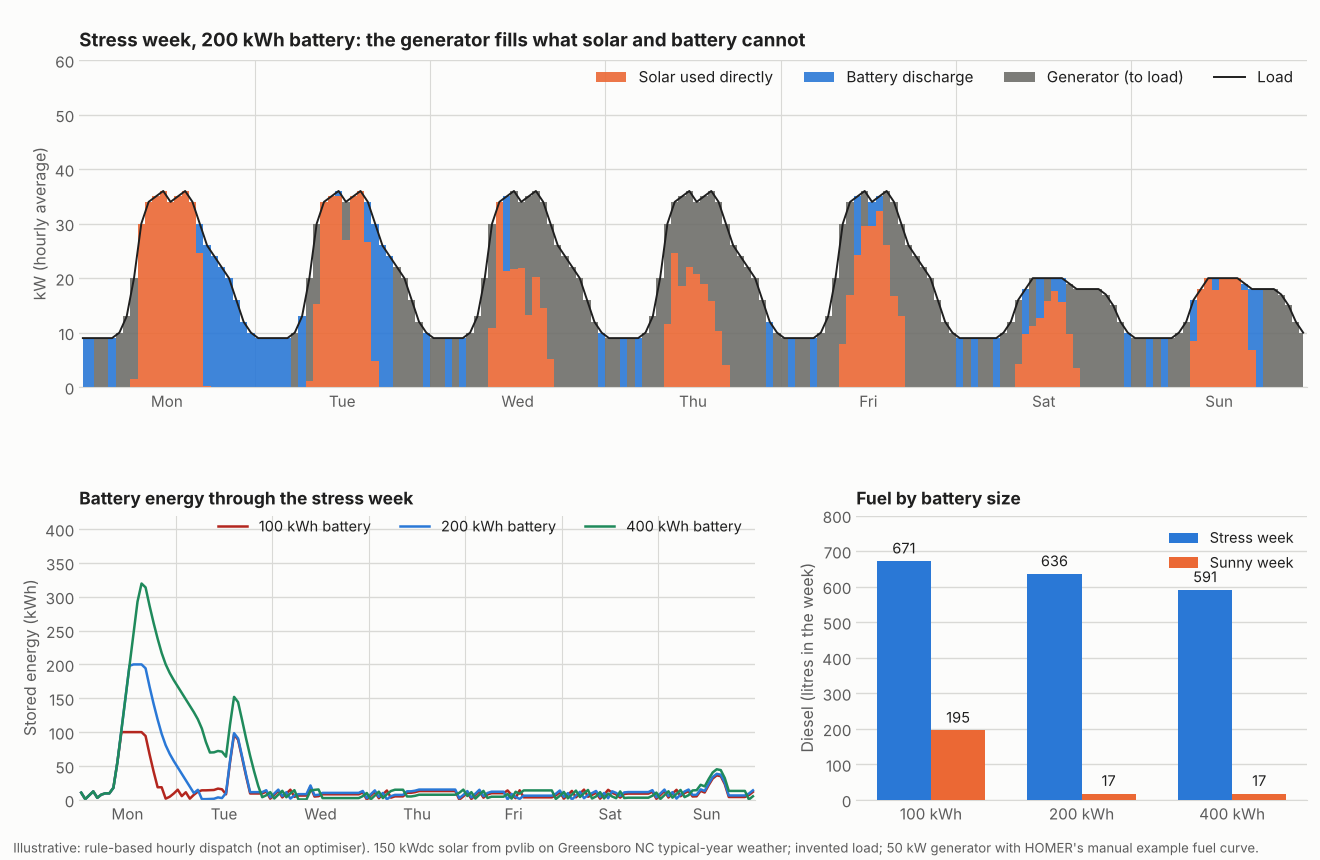
Figure 1. Battery size cut stress-week diesel by only 12% from 100 to 400 kWh. In one sunny week, 200 kWh nearly removed fuel. Illustrative: example load, pvlib solar, rule-based dispatch.
Battery size changes little in the stress week and a lot in the sunny week.
| Case | Renewable fraction | Generator hours (of 168) / starts | Diesel (L) |
|---|---|---|---|
| Stress week, 100 kWh | 45.2% | 106 / 28 | 671 |
| Stress week, 200 kWh | 48.1% | 100 / 28 | 636 |
| Stress week, 400 kWh | 51.8% | 93 / 28 | 591 |
| Sunny week, 100 kWh | 84.6% | 34 / 24 | 195 |
| Sunny week, 200 kWh | 98.6% | 3 / 2 | 17 |
| Sunny week, 400 kWh | 98.6% | 3 / 2 | 17 |
The next table shows the same six cases with the generator removed. It gives the unmet load and the battery energy left at the end of the week.
| Case | Unmet load, no generator (kWh) | Battery kWh at end |
|---|---|---|
| Stress week, 100 kWh | 1,771 (53.4%) | 12 |
| Stress week, 200 kWh | 1,677 (50.5%) | 14 |
| Stress week, 400 kWh | 1,572 (47.4%) | 5 |
| Sunny week, 100 kWh | 450 (13.5%) | 8 |
| Sunny week, 200 kWh | 42 (1.3%) | 108 |
| Sunny week, 400 kWh | 42 (1.3%) | 308 |
Renewable fraction is 1 minus generator kWh over load served. Generator kWh that charge the battery count as non-renewable. With the generator available, unmet load was 0 kWh in every case, because the 50 kW set is bigger than the 36 kW peak. The unmet-load table uses the same rules with the generator removed. All options start at 20 kWh, so they differ by size, not starting energy.
In the stress week every battery is down to 12 kWh or less by midnight on Tuesday. Extra kWh help little. In the sunny week 200 kWh already takes in the surplus. So 400 kWh adds nothing. Over the full typical year the battery counts for much more. That uses the same rules and weekly load pattern.
| Battery, full year (8,760 hours) | Renewable fraction | Generator hours | Diesel (L) |
|---|---|---|---|
| 100 kWh | 72.5% | 2,946 | 17,845 |
| 200 kWh | 85.7% | 1,456 | 9,157 |
| 400 kWh | 91.2% | 879 | 5,597 |
The year has 172,995 kWh of load. It has 212,023 kWh of solar before curtailment. The generator starts 28 times in the 200 kWh stress week. It runs only when the battery is low. Cycle charging is one way to cut starts. An optimiser would search sizes and rules together. This code does not.
At 15 kW, the generator’s minimum load, the example curve burns 0.383 L per kWh. At 50 kW it burns 0.306 L per kWh.
Microgrid dispatch calculator
The "Page example" button reproduces the results table. The load and weather are the same example. This is a teaching aid, not a design.
How solar software handles microgrid design
Of the four tools checked, only HOMER Pro is rated Yes below for a solar, battery and generator microgrid. The other three rate Partly, meaning their pages do not describe a full microgrid. Many solar tools stop at a stand-alone system with a backup generator.
| Software | Models a solar, battery and generator microgrid? | Source, checked October 2026 |
|---|---|---|
| HOMER Pro | Yes | HOMER Pro page (undated) and manual pages for version 3.16 (undated). |
| Xendee | Partly | xendee.com/design. Page data lists a modified date of 2 October 2026. |
| PVsyst | Partly | PVsyst help, stand-alone procedure (undated). |
| PV*SOL premium | Partly | PV*SOL help, system type page (undated). |
What each company page says:
- HOMER Pro: Tests all combinations of system types in one run and ranks them. Finds least-cost microgrid designs. Simulates a hybrid microgrid over a year in steps from one minute to one hour. Dispatch controllers include load following and cycle charging. Has inputs for the generator fuel curve and minimum load ratio.
- Xendee: DESIGN finds the best mix and size of distributed energy resources, with controller dispatch in multi-year runs, and supports 25+ technologies including CHP generators. Its own page names microgrids but does not name islanded operation.
- PVsyst: Stand-alone procedure with a battery pack, a control strategy and a diesel genset backup. The page does not mention microgrids or several energy sources.
- PV*SOL premium: System type "Stand-alone PV System with Backup Generator". The page does not mention microgrids. Edition not named on the page.
These ratings cover microgrid use only. The off-grid page rates stand-alone modelling. For more tools, see the best off-grid solar design software and the best solar battery storage design software.
Common mistakes with microgrid design
FAQs
What is the difference between a microgrid and off-grid?
A microgrid can connect to the grid and disconnect from it. An off-grid system never connects. NREL’s 2019 deck says a microgrid can also stay cut off for good. So the terms overlap at remote sites.
How big should the battery be?
Size it from the outage hours and critical load, then test in a full-year simulation. No single figure fits every site. In the example, ride-through before solar was 5.1 to 20.2 hours for 100 to 400 kWh.
Can a PV inverter form the grid?
Most PV inverters follow the grid, so check the datasheet for a grid-forming mode. NREL’s 2019 deck marks PV as unable to grid-form, and that deck is dated. INL’s 2026 page says grid-forming inverters began with batteries. Confirm the mode with the manufacturer.
What is renewable fraction?
HOMER defines it as the share of energy sent to the load that came from renewable sources. The example uses one minus generator kWh over load served. It leaves out HOMER’s thermal and grid-sale terms and does not count battery losses.
Related terms
- Off-grid system design: sizing array, battery and back-up for a site with no grid.
- Backup power and critical loads: choosing which circuits the system keeps running.
- Battery storage design: kWh and kW for a stated goal.
- 8,760-hour simulation: modelling every hour of the year.
- Peak shaving: cutting demand charges with a battery.
Next step: if your quote promises outage hours, compare the best off-grid solar design software or the best solar battery storage design software.
Sources
- New Jersey BPU microgrid page, quoting the US DOE Microgrid Exchange Group, developed 2012 per the page. Its metadata shows meta-revised 11/03/2017 (checked October 2026).
- NREL slides, Microgrids, 11 December 2019 (checked October 2026).
- INL GridTechPedia: Microgrid Controllers, updated June 2026, and Grid-Forming Inverters, updated March 2026 (checked October 2026).
- NREL paper on black start of microgrids, August 2023 (checked October 2026).
- HOMER Pro manual 3.16, undated: renewable fraction, unmet load, minimum load ratio, fuel curve slope (checked October 2026).
- HOMER dispatch strategies and HOMER Pro pages, undated (checked October 2026).
- Xendee DESIGN, PVsyst stand-alone procedure and PV*SOL system types (checked October 2026).
- NREL TMY3 station 723170 from pvlib sample data. Pvlib 0.16.1 (checked October 2026).
Last updated 30 October 2026. Next scheduled review: 30 January 2027.