Key takeaways
- Size to the label watts, then use the tolerance rule to find the headroom above it.
- Wp and W name the same STC rating. Qcells prints "415 - 440 Wp" on its cover and 430 W in its table. Maxeon prints "440 W" and no Wp.
- The tolerance rule says what the label means. On three invented arrays of about 10 kWp, the printed rules allow 0.115, 0.300 and 0.506 kWp above the label.
- A percentage grows with module size. 5% of 440 W is 22 W, which is 4.4 times a +5 W rule.
- PVsyst turns the tolerance into a default quality loss: a loss for ±3%, but a gain for 0...+3%.
To enter module watts and tolerance in a design tool, see the best solar design software.
Peak watt at a glance
Peak watt is one number on the module datasheet. It is the power at the maximum power point under standard test conditions. Add it up across modules to get the array’s DC size.
| Item | Detail |
|---|---|
| Formula | Array kWp = modules × label Wp ÷ 1,000 (see wattage, kW and kWp). Highest size = modules × (label + upper tolerance) ÷ 1,000. |
| Unit / typical range | W or Wp. Each model prints its own value. The Qcells sheet lists classes from 415 to 440 W and the Jinko sheet from 610 to 630 W, both in 5 W steps. |
| Where it matters | Array size on proposals and forms, DC/AC ratio, module library entries, and mismatch or quality-loss inputs in simulation tools. |
| Standard or rule | The Qcells sheet cites IEC 60904-3 for its test conditions. In Australia, Clean Energy Council listing terms cap the binning range and the uncertainty (clauses 28 and 29, as the CEC page cites them). |
| In software | Stored as a module’s nominal or nameplate power, often with a tolerance field. |
Why does the watt rating matter for installers?
It sets the module count, the price per watt and the DC size on forms. The tolerance sets how far the built array can sit above that size. That moves the DC/AC ratio and any size limit. See price per watt.
What do Wp, W, Pmax and Pnom mean on a datasheet?
On the sheets quoted here they all point to one number: the module’s power at STC. "Peak" is trade shorthand for that test point. It does not promise the highest output a module can reach in the field.
| Source | How the rating is printed |
|---|---|
| Qcells Q.TRON BLK M-G2+ series, Rev06, March 2025, NA version | Cover: "415 - 440 Wp". Table row "Power at MPP (PMPP)" in W. Table heading: "MINIMUM PERFORMANCE AT STANDARD TEST CONDITIONS, STC". |
| Jinko Tiger Neo JKM610-630N-78HL4 (footer "©2022", no revision code) | Table: "625Wp". Header: "610-630 Watt". Front page: "Positive power tolerance of 0~+3%". |
| Maxeon 6 COM, REV B, February 2024 | "Nominal Power (Pnom)" "440 W". "Power Tolerance +5/0%". Wp does not appear. |
| Clean Energy Council (Australia), PV module listing terms, effective 15 August 2023 | Notes say "maximum power rating (Pmax)" in W. The page does not use Wp. |
| PVsyst help, PV modules basic data | Nominal power "is the rated power specified by the manufacturer at STC", also called the nameplate value. |
The pv.de FAQ defines the kilowatt-peak as "the peak performance of a solar module under specified standard test conditions". Read the table row and its test conditions, not the cover label. The NIST caveat on adding letters to units is on wattage, kW and kWp.
How do tolerance rules change what the label means?
The sign and the unit decide it. A "0 to +" rule makes the label a floor. A "±" rule lets modules sit below the label. A percentage and a watt figure give different room.
The three sheets use three forms. Qcells prints "+5 W / -0 W" under a minimum-performance heading. Jinko prints "0~+3%". Maxeon prints "+5/0%", which we read as 0 to +5% because the sheet does not spell it out. On that reading, all three start at zero below the label.
The 2018 JRC paper covers 992 crystalline modules tested from 1982 to 2014. Its abstract says declared tolerance went from "many claiming ±10% in the 80’s and 90’s" to "-0/+3 % are quite common". That describes declarations, not measurements.
Keep the sort tolerance apart from measurement uncertainty. The Qcells sheet prints "Measurement tolerances PMPP ± 3 %" as a footnote. The Jinko sheet prints no such note. The Maxeon sheet prints "(+/−3%)" on Voc and Isc and gives none for Pnom. The ±3% maths is on the standard test conditions page.
What is power binning?
Binning is sorting finished modules into power classes by measured output. The class label, such as 425 W or 430 W, names the bin. The CEC example requires factory flash-test results to fall inside the binning range.
Australia’s Clean Energy Council states limits for modules it lists. Its notes say the Pmax uncertainty at STC "shall be no more than +/-5%" for crystalline modules (clause 28). The lower end of the binning range must be no more than 5 W below nominal (clause 29). The note accepts -3 W and rejects -10 W. The Council’s example is a module labelled 440 W with a ±5 W binning range and ±3% uncertainty. A module with a measured 434 W at production "cannot be labelled as a 440W module".
| Item | Calculation | Result |
|---|---|---|
| Bin range for the 440 W label | 440 ± 5 W | 435 to 445 W |
| Measured module | 434 W is below 435 W | Not a 440 W module |
This is Australian listing guidance, written as an example. Other countries and makers set their own ranges, so read the sheet you have. The uncertainty is a measurement figure and is not part of the bin.
How do you read the watt rating on a datasheet?
Read six things in order, and record the rule with the model code.
- Find the STC table and check its conditions. The Qcells footnote reads "1000 W/m2, 25 ± 2 °C, AM 1.5 according to IEC 60904-3".
- Pick the column for your power class and note whether the cover says Wp while the table says W.
- Read the tolerance form: watts or per cent, and whether it starts at zero.
- Find any measurement tolerance footnote and keep it separate.
- Work out the label total and the highest total: modules × (label + upper tolerance) ÷ 1,000.
- Compare both totals with the inverter’s DC input limit. See DC/AC ratio and equipment datasheets.
Worked example: three printed rules on arrays of about 10 kWp
Each row uses a real module and its printed rule. The module counts and the 8.000 kWac inverter are example. The Maxeon rule is read as 0 to +5%.
Each rule allows a different gap above the label. The first table is per module. The second gives array totals.
| Datasheet and rule | Label | Highest per module | Modules (example) |
|---|---|---|---|
| Qcells 430 W, +5 W / -0 W | 430 W | 435 W | 23 |
| Jinko 625 Wp, 0~+3% | 625 W | 643.75 W | 16 |
| Maxeon 440 W, +5/0% | 440 W | 462 W | 23 |
| Datasheet | Array at label | Array at highest | Room above label | DC/AC at label and highest |
|---|---|---|---|---|
| Qcells | 9.890 kWp | 10.005 kWp | +0.115 kWp (+1.16%) | 1.236 and 1.251 |
| Jinko | 10.000 kWp | 10.300 kWp | +0.300 kWp (+3.00%) | 1.250 and 1.288 |
| Maxeon | 10.120 kWp | 10.626 kWp | +0.506 kWp (+5.00%) | 1.265 and 1.328 |
On our 0 to +5% reading, the Maxeon array could reach 10.626 kWp. The ratio rises most on the Maxeon array, by 0.063 (1.265 to 1.328), so test the inverter’s DC input limit at the top of the range.
Simulation tools can also use the tolerance. PVsyst’s default quality loss starts from the module’s tolerance. The help page prints two cases, which the table applies to an example 12,000 kWh before loss.
| Tolerance entered | PVsyst default loss, as printed | Result on 12,000 kWh (example) |
|---|---|---|
| ±3% | 1.5% | 11,820 kWh |
| 0...+3% | -0.75% loss, which is a gain | 12,090 kWh |
The gap is 270 kWh, or 2.25 percentage points of the 12,000 kWh. A Jinko-style 0~+3% rule gives the second row when you enter 0 and +3% as the limits. The value is a default. A reply on PVsyst’s own forum (17 May 2016) says the tolerance sets the project’s default. You can enter another value. The help page words the rule as "one-quarter of the difference between these values", meaning the two tolerance limits. A positive-only range gives a negative loss, which the help page treats as a gain, so the -0.75% in the table is a gain of 0.75%.
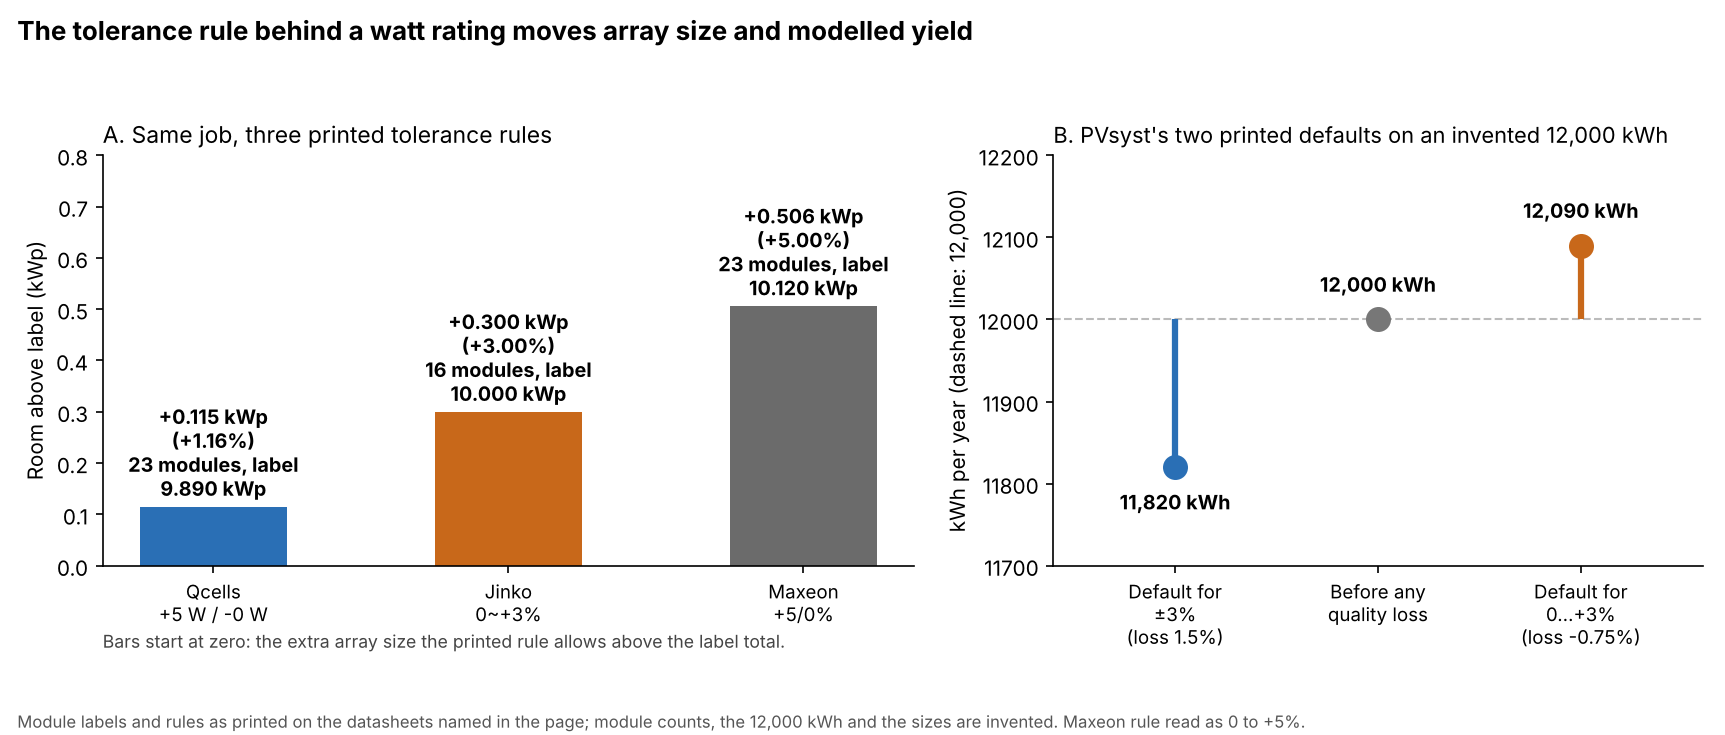
Figure 1. Room above the label grows from 0.115 to 0.506 kWp across three printed rules, and PVsyst’s two printed defaults differ by 270 kWh.
Peak watt tolerance calculator
Enter the module count, label watts, tolerance and inverter AC size. It returns the lowest, label and highest totals and the DC/AC ratio at each. The presets reproduce the first table.
How solar software handles the peak watt rating
Of the three tools read, PVsyst and HelioScope document the tolerance as a separate input, while SAM defines the nameplate figure but not the tolerance. Ratings follow the page named in the last column, read in October 2026.
| Software | Documents the rating and its tolerance? | Page read |
|---|---|---|
| PVsyst | Yes | PV modules basic data and Module quality losses help pages (both undated) |
| HelioScope | Yes | Help centre, Mismatch Calculations (no date printed) |
| SAM | Partly | SAM help, PV system design (undated) |
- PVsyst: nominal power "is the rated power specified by the manufacturer at STC". Tolerances "are the rated limits of the Nominal power dispersion, given by the manufacturer". They are "used as default value for the Module Quality Loss parameter".
- HelioScope: lists "Module nameplate power differences (i.e. module binning)" as a mismatch input. It takes the power tolerance per cent from the module’s electrical data (spec sheet) and applies it as differences in current.
- SAM: "Nameplate DC capacity, kWdc" is "The maximum DC power output of the array at the reference conditions shown on the Module page". The page read does not mention tolerance or binning.
Partly means the page defines the nameplate figure but not the tolerance. See also mismatch loss. For module libraries and loss inputs across tools, see the best solar simulation software.
Common mistakes with peak watt
FAQs
Is Wp the same as W?
Yes. Wp and W both name the module’s STC rating. Qcells prints Wp on the cover and W in its table. Wp is not a higher peak output. Units are on wattage, kW and kWp.
Can a module labelled 440 W test below 440 W?
Yes, if the rule allows it. A ± rule, or the Australian ±5 W bin, lets a 440 W module measure 435 to 439 W. A 0 to + rule, as on the Qcells and Jinko sheets, does not. Maxeon prints +5/0%, which we read as 0 to +5%. If that reading is right, it is the same kind of rule. Under the Australian bin, 434 W cannot carry a 440 W label.
Which watt figure goes into a design tool?
Enter the label watts as the nameplate figure. If the tool has a tolerance field, enter the sheet’s lower and upper values. PVsyst’s page calls the tolerances "the rated limits of the Nominal power dispersion".
Is peak watt the most power a module can produce?
No. Peak watt is the rating at standard test conditions, a lab figure. Field output moves with light and cell temperature. A tolerance rule sets how far a module may sit above or below the label.
Related terms
- Wattage, kW and kWp: units, and the DC and AC size of one system.
- Standard test conditions: the 1,000 W/m², 25 °C and AM1.5 basis of the rating.
- Solar panel (module): the parts and datasheet fields behind the rating.
Next step: enter the label watts and tolerance into a tool from the best solar simulation software list and compare its loss with the printed defaults above.
Sources
- Datasheets (checked October 2026): Qcells Q.TRON BLK M-G2+ series, Rev06, March 2025, NA version (distributor copy). Jinko JKM610-630N-78HL4 datasheet (©2022, no revision code). Maxeon 6 COM 440 W, REV B, February 2024.
- Rules and research (checked October 2026): Clean Energy Council, products terms and conditions (effective 15 August 2023). Lopez Garcia and Sample, Solar Energy, online 11 January 2018, JRC110522 (abstract only). pv.de, kilowatt-peak FAQ (undated).
- Tools (checked October 2026): PVsyst, PV modules basic data. PVsyst, Module quality losses. PVsyst forum thread, replies of 30 March 2015, 2 April 2015 and 17 May 2016. HelioScope, Mismatch Calculations. SAM help, PV system design.
Last updated 30 October 2026. Next scheduled review: 30 January 2027.