Key takeaways
- IEA PVPS Task 13 (February 2026) says a twin has data flowing both ways. Plant-to-model flow alone is a digital shadow, and company pages we read show shadows at most.
- On our invented 250 kWdc plant, a twin calibrated on 120 days saw a 2-hour outage in 100 of 100 runs with no hourly false alarms.
- On a slow soiling ramp, a 0.97 weekly limit alarmed after a median 24 days. A 0.98 limit was faster but gave 3.9 false-alarm episodes a year.
- A 3% irradiance sensor error looked like plant loss. The same error during calibration got absorbed, so it never alarmed.
- Of five companies, only 3E’s page plainly documents measured against expected energy. IBM and Wattch do so partly. Raptor Maps uses "digital twin" for an anomaly map.
To run this comparison across many sites in software, see the best solar monitoring software.
Digital twin at a glance
A twin turns weather and plant data into an expected output. Then it compares that with the measured output.
| Item | Detail |
|---|---|
| Core output | Residual = measured minus twin, or the ratio measured divided by twin, for the same period. |
| Inputs | As-built model, measured weather and irradiance, inverter and meter data, a calibration window. |
| Where it matters | Performance reviews, fault finding, loss analysis, O&M. |
| Standard or rule | The pages read name no standard for the term. The IEA PVPS Task 13 report T13-34:2026 is guidance, not a standard. |
| In software | Asset-performance and monitoring platforms. Design tools hold the as-built model. |
What is a digital twin used for, and why does it matter?
A twin gives an expected output to hold against what the plant made, and the gap points toward causes. Companies describe the first three uses below. The last two are our reading. Our example tests the first and third.
- Expected against actual: 3E describes a gap analysis of expected and measured energy.
- Loss attribution: 3E’s page counts 21 loss types, 13 of them recoverable. IBM’s Maximo Renewables page counts 15.
- Fault detection: IBM claims it detects deviations as small as 1 to 2%. Its page gives no test data.
- Forecasting: run the same model on forecast weather. This is our reading. See solar power forecasting.
- What-if: change an input, such as a repair, and rerun. This is our reading. No company page we read describes it.
The money case is modest in our synthetic year (seed 1000). Soiling cost 4,305 kWh, 1.1% of the clean year. The outage cost 363 kWh, 0.09%.
Savings claims come from companies, and we saw no independent check. Wattch cites fewer truck rolls. 3E’s white paper page cites a 2 to 3% yield gain at one unnamed owner with 170 or more sites.
How is a digital twin different from a design simulation or monitoring?
A design simulation predicts a typical year. Monitoring reports what happened. A twin predicts what should have happened in the actual weather.
| Design simulation | Monitoring | Digital twin | |
|---|---|---|---|
| Question | What will it produce? | What did it produce? | What should it have produced, and why not? |
| Weather | Typical year (TMY) | Not needed | Measured for the period |
| Model | As designed | None, or a simple limit | As built, calibrated |
| Output | Yield estimate | Measured data and alerts | Residual and loss split |
| Updated | At each design revision | Continuously | Continuously. Refitted after repairs or sensor changes |
3E’s product page makes the same split. Predicted energy comes from a normal meteorological year. Expected energy comes from measured weather. See energy yield simulation and the 8760 hourly simulation for the design side.
IEA PVPS Task 13 splits them by data flow (Section 4.1, page 38). A digital model has no automatic data exchange. A digital shadow has an automatic flow from plant to model. A twin has flows both ways. No company page read describes data returning to the plant. By that test, the company products we read are shadows at most, and so is our example below.
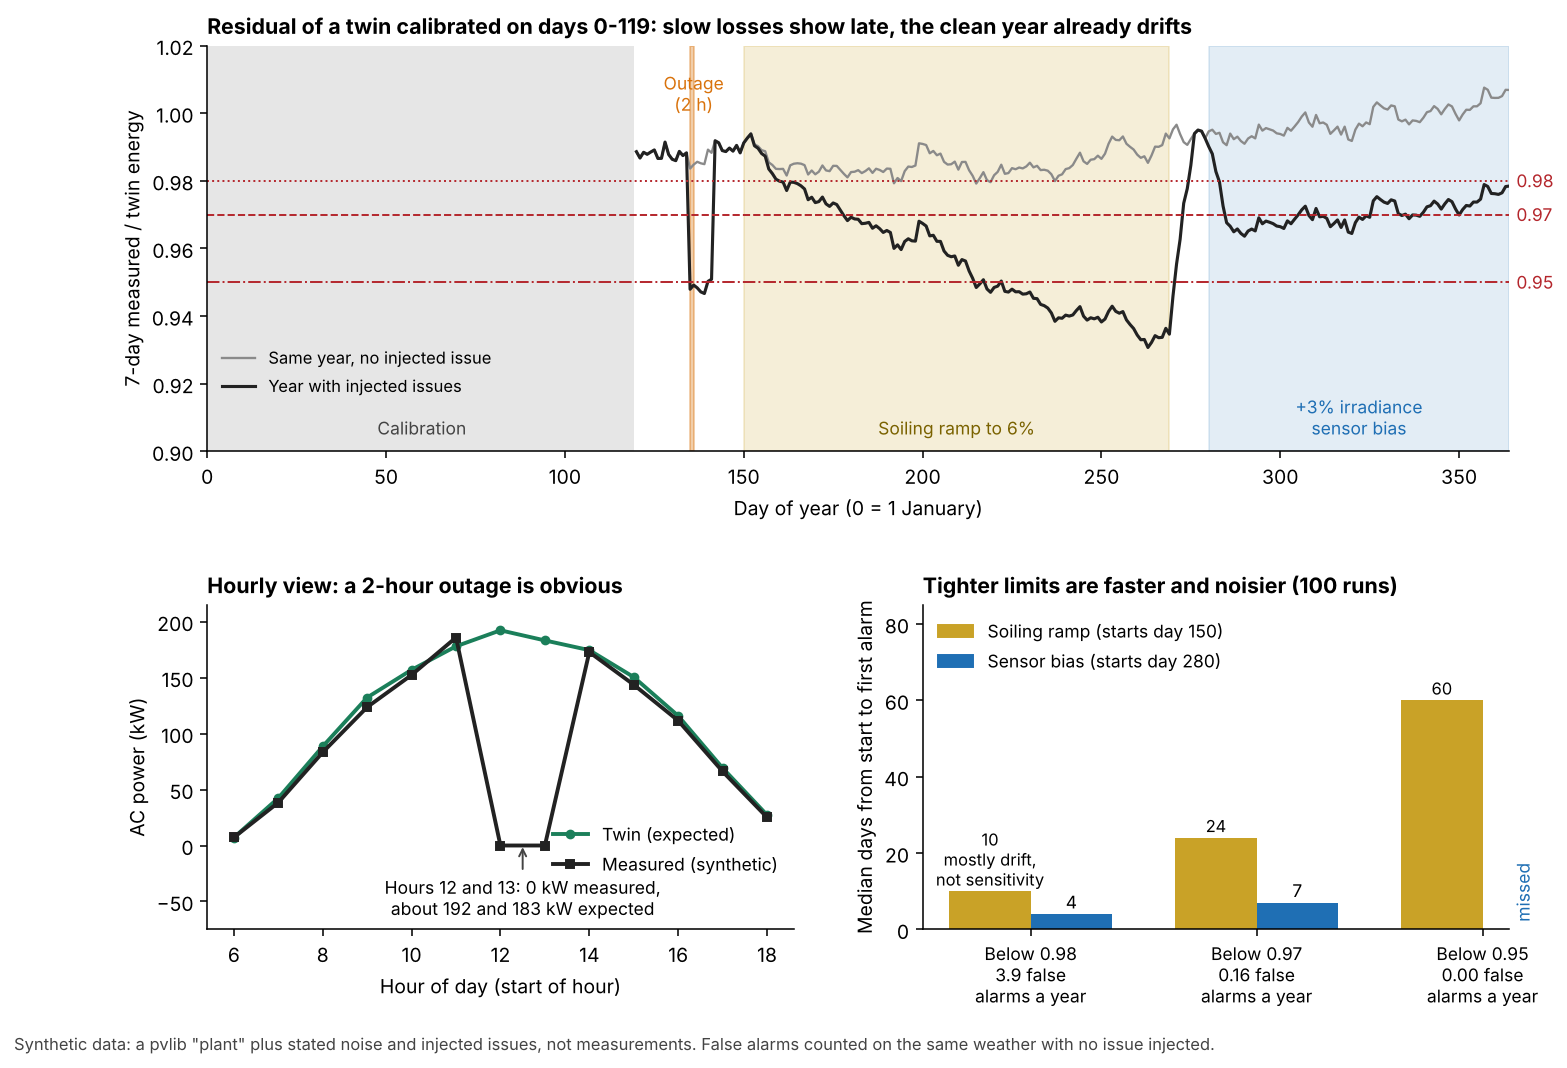
Figure 1. On a synthetic year, a twin calibrated on 120 days saw the 2-hour outage at once. The slow soiling loss and the sensor error showed only as a drifting ratio. Tighter limits raised false alarms.
What does a digital twin need?
It needs an as-built model, measured weather, power data from inverters or meters, and a calibration window. The quality of each limits the result.
- As-built model: modules, strings, inverters, tilt, azimuth and shading as installed. Wattch stresses the site "as installed, not as designed". See the commissioning record.
- Measured weather: plane-of-array irradiance and temperature. A pyranometer is better than satellite data. IEA warns that timestamp misalignment, sensor inaccuracies and data gaps can undermine models and decision tools (Section 2.2.1, page 22).
- Power data: inverter or meter output on the same clock, gathered through SCADA or a logger. Curtailment set points matter. Without them, a limit reads as a fault.
- Calibration: fit a few unknown factors on a clean window, then hold them fixed. Refit only after a repair or sensor change. None of the company pages read says how its model is calibrated.
Published tests are thin. A 2024 IEEE paper (Abdelrahman and others) used a simulated 19 kW testbed. It reported no detection or false-alarm rates. A 2025 ISES abstract gave no accuracy figures.
Worked example: what a calibrated twin catches and misses
A pvlib model of a stated array makes synthetic "measured" data with noise and three injected events. A twin is then calibrated and its alarms are counted.
| Setup item | Value (example) |
|---|---|
| Plant | 250 kWdc, 20 degree tilt, south, 200 kWac inverter, Tucson position, hourly, 2025 |
| Synthetic measured data | Plant model with an IAM loss, real wind, a -0.35 %/K temperature coefficient and a 0.86 DC loss factor |
| Noise | 1.5% on irradiance, 0.5% on power, 0.5 K on temperature |
| Twin | Simpler model: no IAM, wind fixed at 1 m/s. It fits a scale factor and a temperature coefficient on days 0 to 119 |
| Injected events | Day 135: inverter outage, hours 12 and 13. Days 150 to 269: soiling ramp to 6%, then washed. From day 280: irradiance sensor reads 3% high |
| Real or false | Outage and soiling are real losses. The sensor error is no plant loss, so an alarm on it is a false alarm for plant health |
| Hourly rule | 2 judged hours in a row below 70% of twin |
| Weekly rule | 7-day measured over twin energy below a limit for 3 days |
| Skipped hours | Hours with twin below 10% of rating are not judged |
| Counting | 100 runs, new weather and noise, same event dates. False alarms are counted on the same weather with no event, after day 119 |
Both sides use pvlib building blocks, so a real plant can behave less cleanly than this test.
The hourly rule catches the outage cleanly.
| Rule | 2-hour outage | Soiling ramp: median days to first alarm (true loss then) | 3% sensor error: median days to alarm | False-alarm episodes in a clean year, mean (5th to 95th percentile) |
|---|---|---|---|---|
| Hourly, below 70% | Seen in 100 of 100 runs | Not designed for it | Not designed for it | 0.00 (maximum 0 in 100 runs) |
| Weekly, below 0.98 | Seen in 100 of 100 | 10 (0.5% loss, this is mostly drift) | 4 | 3.88 (1 to 6). 97 runs in 100 had at least one |
| Weekly, below 0.97 | Seen in 99 of 100 | 24 (1.2%) | 7 | 0.16 (0 to 1). 14 runs in 100 |
| Weekly, below 0.95 | Seen in 57 of 100 | 60 (3.0%) | Missed in 100 of 100 | 0.00 |
The twin drifts, and the 0.98 limit sits inside that drift. In a clean year the weekly ratio averaged 0.979 from June to August and 0.996 from October to December. The summer 5th to 95th percentile was 0.975 to 0.983.
Calibration covered only the first 120 days. The fitted coefficient was -0.25 %/K against the true -0.35 %/K, so the twin over-predicted in hot months. Fitting on the full year gave -0.33 %/K and no false alarms (case C).
| Calibration case | Soiling, below 0.97: median days (true loss) | 3% sensor error, below 0.97 | False episodes in a clean year, below 0.97 |
|---|---|---|---|
| A: days 0 to 119, as above | 24 (1.2%) | Alarm in a median 7 days | 0.16 |
| B: the 3% error present from day 0 | 22 (1.1%) | Never alarmed (0 of 100) | 0.31 |
| C: fitted on the full year, issues included | 88.5 (4.5%) | Never alarmed at 0.97 (0 of 100). At 0.98, caught in 66 of 100 runs | 0.00 |
Fitted scale and temperature coefficient: A 0.858 and -0.25 %/K, B 0.834 and -0.24 %/K, C 0.852 and -0.33 %/K.
In case C the weekly outage rule saw the 2-hour outage in 74 of 100 runs at 0.98. At 0.97 it saw it in 18 of 100 runs.
- Caught: the outage, by the hourly rule, every run. Soiling, by a weekly rule, but late.
- Misleading: the sensor error alarmed like a plant loss. The twin cannot tell the two apart.
- Missed: a sensor error present during calibration. The scale factor fell 2.8%. The twin learned the error as a plant property.
- Trade-off: full-year fitting removed false alarms but absorbed soiling. That delayed its alarm to a median 88.5 days.
For daily-ratio alarm rules, see alerts and alarms. For the loss itself, soiling.
Count residual alerts from your own series
Paste expected and measured values to count alert episodes.
| Preset | Limits | Result |
|---|---|---|
| Outage day, 13 hourly rows | 30%, 2 in a row, minimum 20 kW | 1 episode, 0 false alarms. 12 judged, 1 skipped |
| Same rows | 5%, 1 in a row | 3 episodes, 2 of them false alarms |
| Same rows | 30%, 3 in a row | 0 episodes. The known outage is missed |
| Soiling, 70 daily rows | 3%, 3 in a row, minimum 100 kWh | 5 episodes, 25 alert periods, 0 false alarms |
| Same rows | 5%, 3 in a row | 0 episodes. The known soiling run is missed |
The rows are synthetic output of this page’s simulation (fixed random seed 1000). The known-issue flag is 1 on days 150 to 209. The limits are ours, not a standard.
How solar software handles digital twins
Only the SynaptiQ page plainly says it compares measured energy with expected energy built from measured weather.
| Software | Measured against expected energy documented? | Source (checked October 2026) |
|---|---|---|
| 3E SynaptiQ | Yes | 3E Solar Analytics page. 3E blog. |
| IBM Maximo Renewables | Partly | IBM docs, Energy loss analysis. |
| Raptor Maps | Not stated | Raptor Maps Knowledge Hub. Features page. |
| PVcase (Ground Mount, Yield) | Not stated | PVcase white paper. Answers page. |
| Wattch | Partly | Wattch insights article. |
Not stated: the company page we cite does not say. Partly: the page describes some of the comparison but not all of it.
- SynaptiQ: "Physics-based digital twin". Expected energy "using measured weather data". 21 loss categories, 13 recoverable. A 30 June 2021 blog adds inverter-input comparison. Limits: no calibration, accuracy or what-if. No page date (footer 2023).
- IBM Maximo Renewables: "the system creates a digital twin for each inverter". Claims 1 to 2% deviations are detectable. 15 loss categories. Limits: no expected baseline or inputs defined. No date or version.
- Raptor Maps: "Raptor Maps creates a Digital Twin for each of your solar sites": a dashboard, map view and list view of anomalies. Limits: no expected baseline, inputs or calibration. No date printed.
- PVcase (Ground Mount, Yield): a twin is a "parametrized (2D/3D) model" of the plant’s physical information. Comparison with monitoring data is only a possible use. Limits: a 2023 concept paper with static asset information, no live data or calibration.
- Wattch: a component model plus real-time simulation. Four inputs, including as-built configuration and control set points. Limits: a marketing article. Its 1 to 2% claim has no validation. Body undated (related list shows 1 July 2025).
Tools that run these checks across many sites are ranked in the best solar monitoring software and best solar asset management software lists. Module-level data is covered under module-level monitoring.
Common mistakes with digital twins
FAQs
What is the difference between a digital twin and a digital shadow?
IEA PVPS Task 13 separates them by data flow: a shadow gets data from the plant automatically, and a twin has automatic flows in both directions. No company page read describes data returning to the plant. By that test, the stricter label would be a shadow.
How accurate is a PV digital twin?
Accuracy depends on the model, the weather data and the calibration, and the company pages read give no third-party test results. Wattch says single-diode modelling "can be as accurate as 1-2%". Our deliberately simple twin had an hourly residual of -1.8% (mean) and 2.8% (standard deviation) in a clean year. That tells you nothing about a company’s model.
Is a digital twin the same as a performance ratio or index?
No. Performance ratio uses a nameplate-based reference. A twin divides by the energy a model predicts for the actual weather. A 3E blog quotes a customer who found that comparison fit warranties better than performance ratio.
Do I need a digital twin for a small system?
Not as a separate product. For a small system, first compare metered kWh with a monitored expected-output model. Twins are sold for fleets of sites, and no page we read gives a system size at which one pays back.
Related terms
- Expected vs actual production: measured energy compared with a model’s prediction.
- Performance ratio: output compared with a nameplate-based reference.
- Alerts and alarms: rules that turn a residual into a message.
Next step: to find a platform that holds expected output beside metered output, compare the best solar monitoring software or the best solar O&M software.
Sources
- IEA PVPS Task 13 report T13-34:2026, February 2026, its summary and full report (checked 30 October 2026). This page uses the report text up to Section 4.2.2.
- Abdelrahman and others, digital twin event detection in PV systems, 2024 (checked October 2026).
- Castilho and others, ISES Solar World Congress paper, 3 November 2025, abstract only (checked October 2026).
- 3E SynaptiQ Solar Analytics (checked October 2026).
- 3E blog, 30 June 2021, and 3E white paper page, 14 October 2024 (checked October 2026). The full paper is gated.
- IBM Maximo Renewables, Energy loss analysis (checked 30 October 2026).
- Raptor Maps Knowledge Hub article and features page (checked October 2026).
- PVcase white paper, 2023 and PVcase answers page (checked October 2026).
- Wattch, Digital Twins and You (checked 30 October 2026).
Last updated 30 October 2026. Next scheduled review: 30 January 2027.