Key takeaways
- A 640 x 512 camera 30 m from a 2278 x 1134 mm module gives 30.3 mm per pixel, or 75 x 37 pixels. The half-cell outline is 3.1 pixels wide.
- FLIR’s 3 x 3 advice is for a spot reading. An assumed 20 mm hot spot is 0.7 pixel wide. It needs 6.6 m or closer.
- A 20 mm spot the camera cannot resolve fills 44% of a pixel. It shows an 11.5 K rise instead of the assumed 25 K (illustration).
- Set emissivity to 0.95 on glass of 0.85 and the module reads 3.6 K low. The hot-spot rise reads 1.7 K low (assumed inputs).
- IEA PVPS Task 13 says the IEC technical specifications carry no pass or fail criteria. So the report author picks the severity bands.
To run thermal inspections in software, see the best solar thermal inspection software.
Thermal inspection at a glance
| Item | Detail |
|---|---|
| Core maths | GSD = IFOV x distance, where IFOV = pixel pitch ÷ focal length. Temperature needs emissivity and reflected temperature. |
| Conditions as printed | IEA PVPS Task 13 (2018): above 600 W/m2, in weather that gives temperature differences above 2.5 K. A FLIR application note says 500 W/m2 or higher, with 700 W/m2 advisable. The two differ. |
| Where it matters | O&M surveys, warranty evidence and fault finding. It is one of the extra tests listed in the commissioning report. |
| Standard | IEC TS 62446-3 covers outdoor thermography. This page does not state its limits or edition. See IEC 62446-3. |
| In software | Radiometric image viewers, drone mapping tools and inspection platforms. |
Why does thermal inspection matter for installers?
It shows where lost output is, not just that it is lost. A monitoring alert says a string is low. An infrared image can show which module, junction box or connector is hot.
That turns an alert into a repair ticket for the O&M crew. A module with an active bypass diode also pulls its string down, as mismatch loss explains. Flights are covered on drone inspection.
What does a thermal inspection find?
A hot part stands out against similar neighbours, and the pattern points to a cause. A second test should confirm it. The follow-up tests below are our suggestion.
| Finding | Confirm with |
|---|---|
| Hot spot | Clean and re-image to rule out dirt, then I-V curve tracing. |
| Bypass diode | I-V curve, which shows a step. |
| String or module outage | String current and open-circuit voltage readings. |
| Loose connection | Torque and contact check, after isolating. |
| PID | Electroluminescence or I-V. See electroluminescence testing. |
| Cell crack | Electroluminescence. |
- Hot spot: local short circuits or poor cell contact can cause one (IEA PVPS Task 13). Shading by bird droppings or small crops can also cause one. See hotspot.
- Bypass diode: an active diode runs hotter than inactive ones (IEA). An activated diode typically affects about a third of the module (Raptor Maps). FLIR describes a patchwork pattern. See bypass diode failure.
- String or module outage: inactive areas usually look hotter. Disconnected modules, shorted diodes and PID give only a slight rise (IEA). In its example the expected rise was about 5 K and the measured rise 1.5 K.
- Loose connection: IEA shows overheating at a loose cable connection and an open junction box terminal. Raptor Maps lists Junction Box and Combiner anomalies.
- PID: IEA says warmer cells near the frame, or patchwork patterns, on modules near the negative pole point to PID-s. At open circuit it is not detectable.
- Cell crack: FLIR says part of a cell appears hotter. IEA says cracks can show at lower irradiance, but not every fault heats up.
How is a thermal inspection done?
A thermal inspection images the modules in strong, steady light. It uses a radiometric camera close enough to resolve the fault. Each of those choices has a limit backed by a source.
- Light and weather: IEA PVPS Task 13 recommends above 600 W/m2 and says to avoid wind. It says a module needs 5 to 15 minutes to settle after conditions change. The FLIR note wants a clear sky and calm air.
- Viewing angle: the FLIR note calls 5 to 60 degrees off the perpendicular a good compromise. It warns that reflections can look like false hot spots.
- Handheld: IEA says handheld cameras suit field inspection of modules. FLIR asks for at least 320 x 240 pixels, preferably 640 x 480, for longer distances. IEA lists 160 x 120 as a lower class.
- Drone: it covers more modules per hour. Scopito, a company, says drones give a consistent angle, altitude and resolution. IEA’s 2018 report says aerial work was limited to qualitative diagnosis on small-scale plants.
- Radiometric or not: DJI’s Matrice 4T page lists R-JPEG (16-bit) and JPEG (8-bit). DJI says R-JPEG files embed temperature data. A plain image shows patterns only, so you cannot read a temperature rise from it.
- Resolution: GSD is the ground width of one pixel. FLIR advises covering a hot area with at least 3 x 3 pixels when you need a spot temperature. We apply 3 pixels to the cell outline.
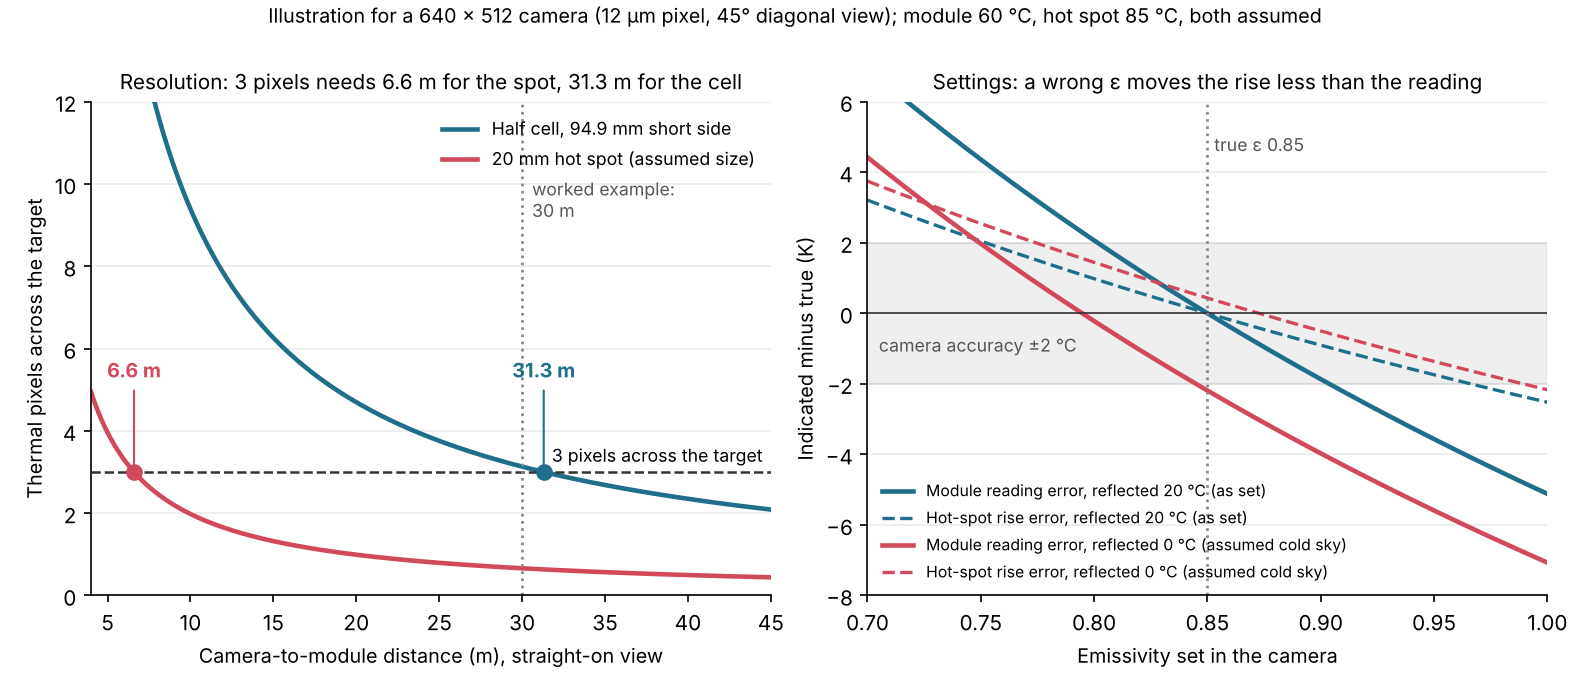
Figure 1. Distance decides whether a small hot spot is resolved. A wrong emissivity setting shifts the reading more than the rise (assumed temperatures).
Worked example: 30 m from a 640 x 512 camera
This is an illustration with assumed temperatures. It shows how pixels, hot-spot size and camera settings work together. Tables show the inputs, results by distance, then emissivity effects.
| Input | Value and source |
|---|---|
| Camera | DJI Matrice 4T thermal: 640 x 512, 12 um pitch, 45° (±0.3°) diagonal field of view, sensitivity ≤50 mK at f/1.0 (DJI specs page, undated, October 2026). |
| Implied optics | DJI does not print the focal length. The 45° view gives 11.87 mm, so IFOV 1.011 mrad. |
| Module | Jinko JKM550-570N-72HL4-BDV: 2278 x 1134 mm, 144 cells (6 x 24). Cell outline 94.9 x 189 mm. |
| Assumed | Straight-on view. 20 mm square hot spot at 85 °C on a 60 °C module. Glass emissivity 0.85 (IEA typical). Reflected 20 °C. |
| Distance (m) | GSD (mm) | Pixels across module | Pixels across half cell / 20 mm spot | Rise shown for spot (K) |
|---|---|---|---|---|
| 10 | 10.1 | 225.4 x 112.2 | 9.4 / 1.98 | 25.0 |
| 20 | 20.2 | 112.7 x 56.1 | 4.7 / 0.99 | 24.5 |
| 30 | 30.3 | 75.1 x 37.4 | 3.1 / 0.66 | 11.5 |
| 40 | 40.4 | 56.3 x 28.0 | 2.3 / 0.49 | 6.6 |
The ±0.3° tolerance on the DJI view gives 1.003 to 1.018 mrad, and the 53 mm equivalent focal length on DJI’s specs page gives 0.996 mrad. The Jinko sheet is a Chinese-market sheet (code F1-CN, undated), and its cell outline includes frame and gaps, so the true cell is smaller.
The last column mixes the spot with its surroundings by area. It uses the Stefan-Boltzmann law, where radiated power rises with the fourth power of temperature. We ignore lens blur, which would make it worse. The true rise is 25 K.
The half cell meets 3 pixels out to 31.3 m, or 31.1 to 31.5 m across the field-of-view tolerance. If the camera is 16.6° or more off the module normal, the count drops below 3 at 30 m. The spot needs 6.6 m.
The next two tables show how the emissivity setting and the true reflected temperature shift the readings. First, a true reflected temperature of 20 °C.
| Emissivity set | Module reading (error K) | Hot-spot rise (error K) |
|---|---|---|
| 0.95 | 56.4 (-3.6) | 23.3 (-1.7) |
| 0.90 | 58.1 (-1.9) | 24.1 (-0.9) |
| 0.85 | 60.0 (+0.0) | 25.0 (+0.0) |
| 0.80 | 62.1 (+2.1) | 26.0 (+1.0) |
Now the same test with a true reflected temperature of 0 °C.
| Emissivity set | Module reading (error K) | Hot-spot rise (error K) |
|---|---|---|
| 0.95 | 54.4 (-5.6) | 23.6 (-1.4) |
| 0.90 | 56.0 (-4.0) | 24.5 (-0.5) |
| 0.85 | 57.8 (-2.2) | 25.4 (+0.4) |
| 0.80 | 59.8 (-0.2) | 26.4 (+1.4) |
True values: module 60 °C, rise 25 K. A higher emissivity setting reads cooler, and so does a colder real reflection. Rise errors stay within 1.7 K here, against reading errors up to 5.6 K. DJI specifies the camera at ±2 °C or ±2%, whichever is greater, in high gain mode. Our own Planck integration over 8 to 14 um, not a company figure, changes these errors by at most 0.3 K. Report the rise, the settings and the light level together.
Pixel and emissivity calculator
Enter your camera, distance, module outline, hot-spot size and temperatures. It returns GSD, pixels per cell and spot, the longest distance for your pixel target, and the error from wrong settings. It is a design aid with simplified physics, not a camera model.
How are findings reported and prioritised?
Report each finding with its place, type, temperature rise and the conditions. No standard sets one pass or fail line, so you set the bands and state them.
- What IEA says: images must be matched to location, especially the string plan. A rise of only 1 to 2 K needs care. Up to 8 K can occur naturally across a module. It says severe cell defects with a rise above 15 °C correlate strongly with reduced string current. It states the specifications are not meant to give pass or fail criteria.
- What a company does: Raptor Maps sets default priorities: Low for a cell, Medium for a diode, High for a string or combiner. Cell and junction-box findings have bands. Its glossary prints them as under 10 °C, 10 to 20 °C and 20 °C higher than adjacent areas.
- Our suggested order: heating connections first, for safety. Then the power at stake: string, then module, then cell. Break ties by rise, and re-image after repair.
For the checklist of report contents, see drone inspection.
What can thermal inspection not tell you?
It cannot find every fault, and a hot area is not always a loss. IEA PVPS Task 13 states that infrared alone cannot identify all failure types.
- Cool faults: not all failures raise temperature, and low light can hide some that do.
- Look-alikes: partial shading and dirt can mimic faults. FLIR warns of false hot spots from reflections.
- Hot is not lost: IEA says defects found do not inevitably cause performance loss.
- Small spots: below about three pixels the rise is diluted, as the example shows.
- Open circuit: IEA says PID-s is not detectable at open circuit, because the cell temperature is even.
How solar software handles thermal inspection
Of the six tools below, two clearly read temperature and report thermal findings, and three do so in part. The table rates only what each company page says.
| Software | Reads temperature or reports thermal findings? | Source and date |
|---|---|---|
| Raptor Maps | Partly | Glossary, copyright 2025. October 2026 |
| Scopito | Yes | Solar inspection page, updated 17 November 2025 |
| Zeitview | Yes | Solar page, undated. October 2026 |
| FLIR Thermal Studio | Partly | User manual v2.0, undated. October 2026 |
| DroneDeploy | Partly | Help page, updated 25 March 2026 |
| DJI Thermal Analysis Tool | Not stated | Download page, undated. October 2026 |
- Raptor Maps: Anomaly glossary with 41 types, default priorities and temperature bands for cell findings. That covers findings only. Report contents are not described.
- Scopito: AI and human analysis. Diode, hotspot, string and backsheet findings. Severity levels. PDF and CSV reports with temperature values.
- Zeitview: Thermal inspections detect overheating modules, string imbalances and electrical faults. Reports with annotated imagery and severity.
- FLIR Thermal Studio: Spotmeter, rectangle, polygon and delta tools. Batch processing. Reports saved as .atr files. The text shows no emissivity or reflected-temperature settings.
- DroneDeploy: Radiometric thermal processing (Enterprise). Annotations can mark deficient panels. No automated detection or reports on the page.
- DJI Thermal Analysis Tool: The download page read only names the tool and its versions. DJI’s inspection page is not covered here.
Not stated: the company page we read does not say. Partly: the page shows some of the thermal reading or reporting features, not all.
Tools that read thermal images and report findings are compared in the best solar thermal inspection software. Drone survey tools are in the best solar drone inspection software.
Common mistakes with thermal inspection
FAQs
What is the difference between thermal inspection and drone inspection?
Thermal inspection is the method: imaging heat with an infrared camera. Drone inspection is one way to carry the camera. A handheld camera also does thermal inspection. Flight conditions are on our drone inspection page.
What is the best time of day for a solar thermal inspection?
The best time is strong, steady light with little wind. IEA PVPS Task 13 recommends light above 600 W/m2, and says a module needs 5 to 15 minutes to settle after conditions change.
How close must a thermal camera be to a solar module?
For a 20 mm hot spot to fill 3 pixels, 6.6 m or closer. For a half cell to span 3 pixels, out to 31.3 m. Both figures come from this page’s assumed 640 x 512 camera with a 45° view.
Do I need a radiometric camera?
You need one if you want to read or report temperature differences. A non-radiometric image still shows patterns. It carries no temperature data. Radiometric files may also let you correct emissivity later in a viewer.
What temperature difference counts as a fault?
There is no universal line. IEA PVPS Task 13 says the IEC specifications give no pass or fail criteria and that 1 to 2 K needs care. Companies set their own bands, such as Raptor Maps with 10 and 20 °C steps.
Related terms
- Hotspot: a module area running hotter than its neighbours.
- IEC 62446-3: the thermography guidance standard.
- I-V curve tracing: the electrical test that confirms many thermal findings.
Next step: to turn thermal images into repair tickets faster, shortlist from the best solar thermal inspection software.
Sources
All sources checked October 2026. DJI, Raptor Maps and FLIR pages re-opened 30 October 2026. The text of IEC TS 62446-3 is not quoted on this page. IEA PVPS Task 13 was read as a text extract.
- Technique and limits. IEA PVPS Task 13, Review on IR and EL Imaging for PV Field Applications (2018). FLIR application note, testing solar panels (code T820228, undated). FLIR, understanding distance:size ratio (8 May 2020).
- Equipment. DJI Matrice 4 Series specs. DJI Enterprise, The Basics of Thermal Drones (18 August 2022). Jinko JKM550-570N-72HL4-BDV sheet (F1-CN).
- Software. Raptor Maps anomaly glossary. Scopito. Zeitview. FLIR Thermal Studio user manual v2.0. DroneDeploy thermal mapping. DJI Thermal Analysis Tool download page.
Last updated 30 October 2026. Next scheduled review: 30 January 2027.