Key takeaways
- EL shows cells that are not producing light. It finds cracks that the eye and a power test can miss, plus dark cells and PID.
- EL shows where damage is, not the power lost, and a dark area does not always mean lost power. Follow a worrying image with an I-V trace.
- In a simple model of an invented 60-cell module, a dark area under 6.5% of one cell costs nothing. A 25% dark corner costs 19.8%. The loss caps at 33.3% when a substring is bypassed.
- Field EL is normally done in the dark. Daytime EL with lock-in or SWIR cameras has been trialled, and a 2020 drone trial said it needed more algorithm work.
- Owners use it for baselines at handover, checks after storms, unexplained underperformance and due diligence.
To compare EL image analysis tools, start with the software table. For drone surveys that produce the images, see the best solar drone inspection software.
EL testing at a glance
| Item | Detail |
|---|---|
| What it is | A non-destructive image of a module driven as a light-emitting diode. Zamini and others (2012) say EL relies on light from excited charge carriers recombining in the cells. |
| Current and camera | Sources differ: forward current from 10% of Imp up to about Isc, read by a silicon CCD or CMOS camera. Each source’s values are listed below. |
| Standard | IEC TS 60904-13:2018, edition 1.0 (August 2018). Its scope: capture EL images, derive metrics, and guide qualitative reading, for modules measured with a supply that puts the cells in forward bias. |
| Where it matters | Handover baselines, storm and insurance checks, underperformance work, due diligence. See uses. |
| In software | Batch analysis tools mark defective cells and cracks. See the tool table. |
- Zamini and others: forward current at or below Isc, silicon CCD camera, 300 to 1000 nm.
- Spataru and others (2017): 10% of Imp up to Imp.
- Oliveira and others (2025): about Isc from a supply of Voc plus 3 V, CMOS camera with its infrared filter removed.
Why does EL testing matter for O&M and asset teams?
EL finds damage that power tests can miss. That gives owners evidence for claims and a baseline for later checks.
The IEA PVPS Task 13 failure review (March 2014) says you cannot see cell breakage by eye. Soon after it happens, a power rating often cannot detect it either. pv magazine (May 2020) adds that branching microcracks can break a cell’s metal contacts. That can create hot spots over months or years.
Oliveira and others (SWC 2025) imaged 84 modules from one maker, all meant for a PV plant. They conclude that passing a power test does not prove a module is intact. Their sample is small and from one batch, so read it as an example, not a rate. See degradation rate for what long-term loss looks like.
How does EL imaging work?
EL turns the module into a light-emitting diode. A power source pushes forward current through the cells. They glow in near-infrared, and a camera in the dark records the glow.
- Power the module. Take it out of service or feed it from a supply. Sinovoltaics describes strings powered from outside. An Ingeteam release describes an inverter that energises all its strings at once, with no extra supply.
- Apply forward current. The level varies by source: see the glance table. Spataru and others warn that the dark-area threshold depends on noise, bias and exposure.
- Block other light. Use a darkroom or work at night. For daytime, pv magazine describes InGaAs detectors and a lock-in box. The box sends a pulse and filters out sunlight.
- Capture the image. Cameras named in the sources are silicon CCD, CMOS with the filter removed, and SWIR. A 2020 drone trial in sunlight (reported 3 July 2020) said the process needed more work on its algorithms.
- Map and grade. Oliveira and others took full and close-up images and marked defects on a module map. pv magazine says software sorts defects into low, medium and high risk.
Spataru and others call the worst cracks "inactive": they correspond to completely disconnected cell areas.
What do EL defects look like?
Most defects show as darker areas against bright cells. The pattern, and where it sits in the string, tells you the likely cause.
| Defect | How it looks in EL | Look-alike or limit |
|---|---|---|
| Inactive crack | Black. Spataru and others: "Mode C cracks appear black in EL images irrespective of current level and camera exposure time." | Mode B cracks can look black or grey, and at high bias severe ones can look like mode C. |
| Dark cell | Zamini and others: cells of lower electrical activity appear dark. | The image does not give the cause. |
| PID | EnergyVille (2019): cells show a reduced EL signal, as dark areas. Only cells negatively biased towards the frame suffer PID. pvBuero (2016): worst in cells close to the frame. | EL shows PID but "cannot be deployed to quantify" the loss (EnergyVille). |
| Finger, ribbon and solder faults | Oliveira and others list "Defective Gridfingers" and "Broken Gridfingers" as EL classes. Power magazine (2025) lists broken ribbons and solder faults. | The sources read do not describe the look of each. |
| Stains and scratches | Oliveira and others: "Stain" was the most frequent class, 35.14% of 1,181 recorded defects, in 84 modules from one maker. They link it to manufacturing. | Not all marks are damage. One batch is not a norm. |
| Bypass diode | See bypass diode failure, which cites a source describing the affected substring as dark. There a shorted diode removes one substring and costs about a third of the module power (34.8% in its own model, which is separate from the one below). | A dark cell and a dark substring have different causes. |
How much power does a dark area cost?
A dark area costs power only when it limits the current its substring can carry. In a simple model, small dark areas cost nothing. With one dark substring, the loss stops at one substring’s share.
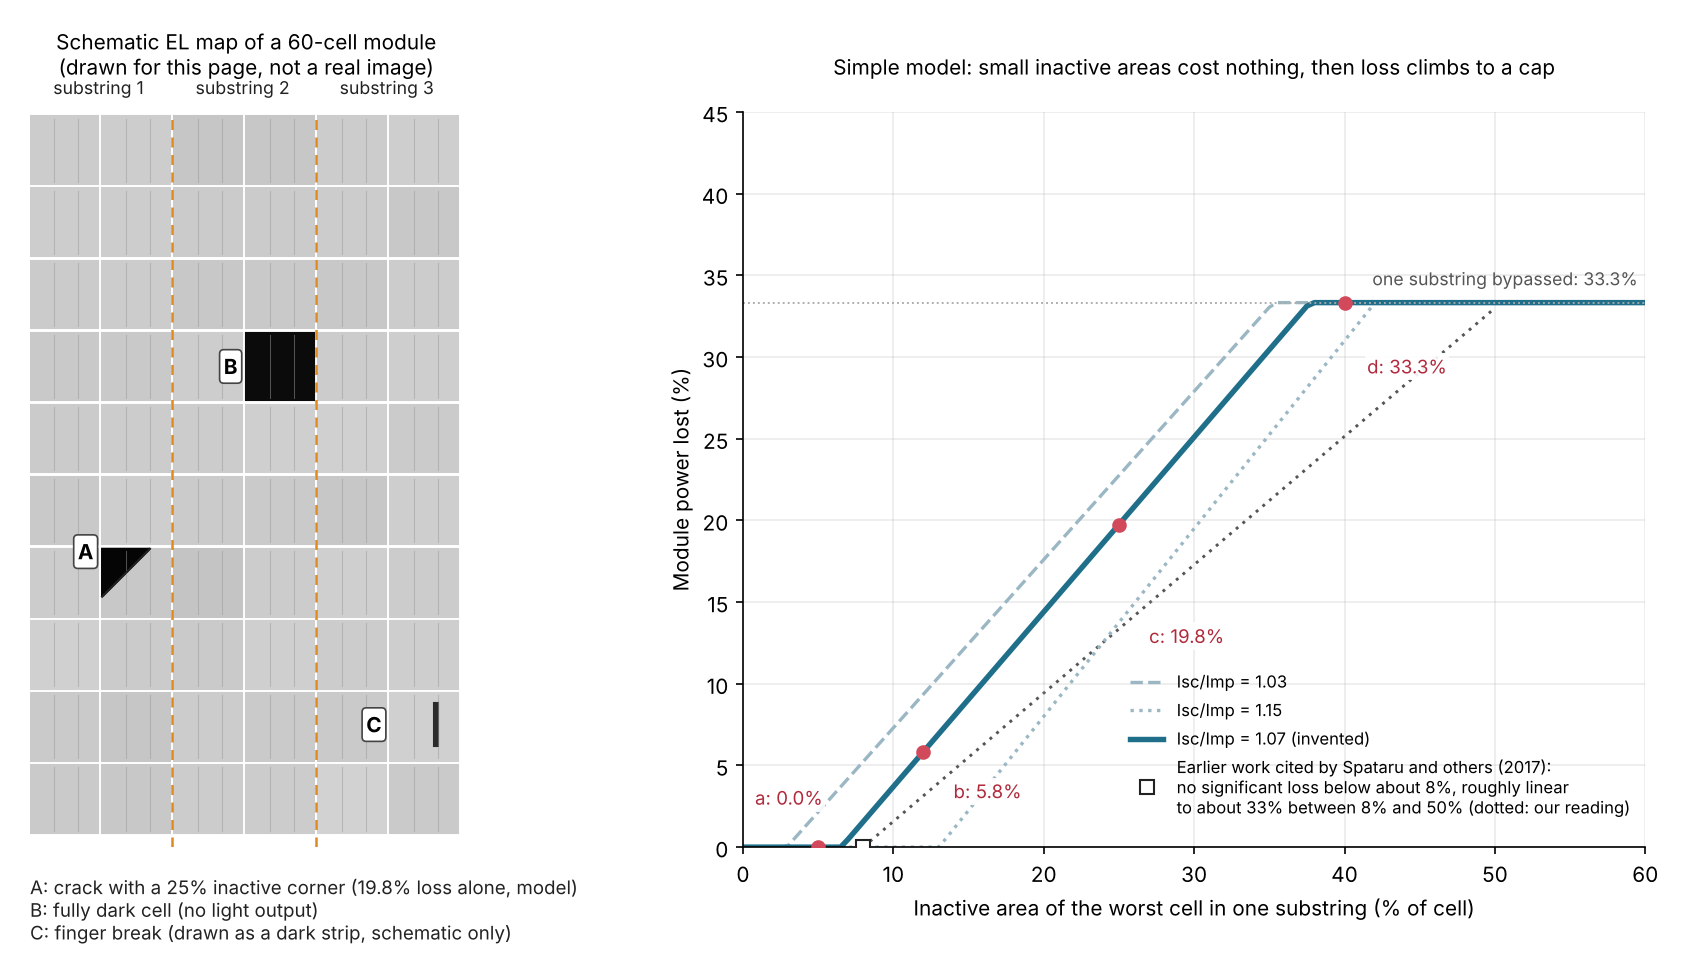
Figure 1. In a simple model of an example 60-cell module, a dark area costs no power below about 6.5% of one cell. The loss then climbs to 33.3% once its substring is bypassed. The left panel is a schematic, not a real image.
In panel A, the 25% corner alone equals 19.8% module power lost (case c). Each substring has one bypass diode. A cell with a dark share f can pass about (1 - f) times Isc. If that is below Imp, the substring either limits the module current or is bypassed, whichever loses less. With Isc/Imp of 1.07 (example), the no-loss limit is 6.5%. Other ratios from 1.03 to 1.15 give limits from 2.9% to 13.0%.
| Case (example module: 60 cells, 3 substrings, Isc/Imp 1.07) | Dark area | Estimated power lost | Bypassed |
|---|---|---|---|
| a | One substring, worst cell 5% dark | 0.0% | None |
| b | One substring, worst cell 12% dark | 5.8% | None |
| c | One substring, worst cell 25% dark | 19.8% | None |
| d | One substring, worst cell 40% dark | 33.3% | Substring 1 |
| e | All 3 substrings, worst cell 12% dark in each | 5.8% | None |
| f | Two substrings, worst cell 40% dark in each | 35.8% | None |
Cases a to d are plotted on Figure 1. Case f loses more than 33.3% because two substrings are hit. In case e, the model gives the same loss as one cell, because the worst cell sets the current. Spataru and others found that total crack area tracked loss better than the largest single crack. This model cannot show that, so treat multi-crack results as rough.
Spataru and others simulated one 250 Wp mc-Si module over 0 to 25% inactive area. They cite earlier work (Köntges and others, 2011). It found no significant loss below about 8%, then a roughly straight-line rise to about 33% of power between 8% and 50%, then a flat top. Ours agrees on the shape and the cap. It reaches the cap at 37.7% of a cell, against earlier work that puts the span at 8% to 50%. See bypass diode failure for the same effect from a diode short.
EL dark-area loss calculator
Enter the substring count, an Isc/Imp ratio from the datasheet, and the dark share of each substring’s worst cell. Defaults are example.
When is EL testing used, and by whom?
Makers use it on output and labs use it around stress tests. Owners use it at handover, after events and when output falls short.
| Use | Who | What the source says |
|---|---|---|
| Factory check | Module makers | Sinovoltaics (webinar summary, 30 December 2025) says EL imaging is performed on modules at PV factories. This is a company claim. |
| Stress-test checks | Module buyers, labs | IBC SOLAR (October 2018) lists EL checks before and after thermal cycling, damp heat and static load tests. |
| Handover baseline | Owners, EPCs, O&M | pv magazine (2020): baselines at commissioning, from a statistical sample of the site. Sinovoltaics says on arrival, before installation. |
| After hail or storms | Owners, insurers | Power magazine (September 2025), by a forensic engineer, reports increased interest from insurance professionals in EL scans to support post-event claims. |
| Underperformance | O&M, asset managers | pv magazine (2020): when visual and conventional tools cannot explain a shortfall. |
| Sale or warranty end | Buyers, owners | pv magazine (2020): evaluating operating plants before acquisition. Sinovoltaics: before warranty expiry. |
Power magazine adds that disconnecting modules makes EL less efficient than drone infrared for large fields. For routine checks, Sinovoltaics offers statistical sampling. For claims and disputes, it offers 100% coverage. The sources give no fixed sample size.
Drone EL is newer. A release dated 9 June 2026 describes an inverter-fed autonomous drone inspection of 18,125 modules across three inverters in Texas. It cites about two hours per inverter section. It does not say if the work ran at night. See drone inspection and thermal inspection.
How solar software handles EL testing
Of four tools checked, three read EL images directly, and the Zeitview release credits its EL analysis to another company. The ratings follow each page’s wording. Useful features to look for are batch image upload, defect marking per cell, a module map and human review.
| Tool | Reads EL images? | Source and date |
|---|---|---|
| pv-vision (open-source Python package) | Yes | PyPI page. Release 4 June 2024. October 2026 |
| SolarAIDD (CSIR, South Africa) | Yes | About page, undated. October 2026 |
| Selma EL Mass Analysis (Sinovoltaics) | Yes (factory images) | Company webinar summary, 30 December 2025. October 2026 |
| Zeitview | Not stated | News release, 9 June 2026. October 2026 (URL dead as of 3 November 2026) |
pv-vision, SolarAIDD and Selma have no solarsoftwares profile, so they are listed from their own pages only. Not stated means the page does not say the company reads EL images itself. Zeitview is named as a partner, but the EL analysis is credited to another company.
- pv-vision: "The methods in this package include EL image preprocessing, defective cell identification, crack segmentation, maximum isolated area prediction, etc." BSD licence. Version 0.2.8 (PyPI listing, checked November 2026).
- SolarAIDD: upload a batch of EL images. AI analysis returns colour maps of defects, cell and module tables, batch statistics and a heat map. The About page does not list the defect classes or a price.
- Selma EL Mass Analysis: described as analysing 100% of modules and marking defects, with human review of results. Over 15 defect types, including finger interruptions.
- Zeitview: a release names Zeitview as a partner in the first US inverter-fed drone EL inspection. It credits the EL analytics platform to Quantified Energy, not to Zeitview. Zeitview’s own EL tooling is not stated on the pages read.
The inspection lists mostly cover drone and thermal work, not EL image analysis. For the drone and thermal side, see the best solar drone inspection software and the best solar thermal inspection software.
Common mistakes with EL testing
FAQs
Is EL testing the same as thermal imaging?
No. EL needs forward current and shows inactive areas. Thermal imaging shows heat and works on energised modules. Zamini and others found modules with normal-looking EL images that still had infrared hot spots, so they recommend using both. See thermal inspection.
Can EL testing be done in daylight?
Yes, with changes. pv magazine describes InGaAs detectors and a lock-in system. Sinovoltaics offers daylight EL with optical filtering where night access is limited. The 2020 drone trial in sunlight said its algorithms needed refining.
Does every dark area mean lost power?
No. A dark area costs power only when it limits the current its substring can carry. Small dark areas can cost nothing: the model above gives 6.5% for an example module. Confirm with an I-V trace.
How many modules should be tested?
Test a statistical sample for routine checks and every module for claims and disputes, as Sinovoltaics offers. No source fixes a sample size, so agree the sample size and pass criteria in the contract.
Related terms
- Bypass diode failure: a diode that no longer works as designed, which can leave a dark substring.
- Anomaly classification: how inspection software labels findings and severity.
- Backsheet and EVA encapsulant: the laminate layers around the cells.
Next step: if you want EL results from a whole site, compare drone inspection tools or thermal inspection tools.
Sources
All sources checked October 2026. IEC TS 60904-13 scope comes from the publisher’s preview, not the full text.
- Papers and reports. Zamini and others, Photovoltaics International, February 2012. Spataru, Hacke and Sera, IEEE PVSC 2017. Oliveira and others, SWC 2025. IEA PVPS Task 13, Review of Failures of Photovoltaic Modules (March 2014).
- Articles. pv magazine India, EL to the field (2 May 2020). EnergyVille, PID expert talk (26 June 2019). pvBuero, methods for detecting PID (15 January 2016). Power magazine (26 September 2025). Unmanned Systems Technology (3 July 2020). IBC SOLAR, module testing methods (October 2018).
- Standard. IEC TS 60904-13 ed. 1.0, VDE Verlag preview with the scope text (checked 30 October 2026). IEC TS 60904-13:2018 ED1, Genorma listing (29 August 2018).
- Companies and tools. Sinovoltaics webinar summary (30 December 2025, rechecked 30 October 2026). Sinovoltaics field EL testing (undated). Zeitview release (9 June 2026) (this URL returned a 404 when re-checked 3 November 2026, the Ingeteam release below covers the same project). Ingeteam release (undated). pv-vision on PyPI. SolarAIDD About page.
Last updated 30 October 2026. Next scheduled review: 30 January 2027.