Key takeaways
- Sources use "technical availability" in different ways. Read the contract, not the label.
- The standard IEC TS 63019 (2019-05) says a plant is available when "capable of providing service".
- All four tool pages that give a figure test for production. None tests for capability.
- One invented 30-day month reads 96.95% to 99.37%, depending on the definition. The example guarantee is 98%.
- Of five tools checked, four document an availability figure. Two let you exclude events. None names a technical vs contractual split.
To track availability in software, see best solar monitoring software.
Availability at a glance
Availability asks whether equipment could produce, not how much it made. It is a ratio of time or energy, shown in percent.
| Item | Detail |
|---|---|
| Basic formula | Sandia (2015), Eq. 1: raw availability of a component = 1 minus downtime ÷ total time in the daily operating window. |
| Unit | Percent of a period, usually a month or a year. |
| Where it matters | O&M guarantees and damages, owner reports, warranty claims, asset management. |
| Standard or rule | IEC TS 63019 (edition 1.0, 2019-05) gives a framework. Contracts set their own exclusions and cut-offs. |
| In software | Monitoring platforms report it per device or per plant, with settings for the cut-off and exclusions. |
Why does availability matter for installers and O&M teams?
A guarantee works only if both sides work out the same number. The same outages can pass or fail under two definitions.
Contract levels and remedies are on the O&M page. Repair clocks are on CMMS. This page covers definitions and maths.
What is the difference between technical and contractual availability?
In some sources, technical counts all downtime. Contractual follows the contract and removes listed events, such as grid outages and force majeure. The table shows where the sources differ.
| Source | What it says |
|---|---|
| IEC TS 63019 (2019-05), Section 3.1 | Availability is where the plant, a subsystem or a component "is capable of providing service", "regardless of whether it is actually in service and regardless of the capacity level that can be provided" (VDE preview). Only part of the text is public. |
| Sandia, Klise and Balfour (SAND2015-10223, November 2015) | Raw time-based availability is "the equipment availability without any excluded events". Contractual availability "has a number of exclusions and rules". |
| SolarPower Europe O&M guidelines v3.0 (December 2018, Autarco copy) | "While uptime reflects all downtimes regardless of the cause, availability involves certain exclusion factors". The contents list technical availability or uptime, contractual availability and energy-based availability as separate items. |
| Soltell (22 December 2022) | Contractual availability "is by default equivalent to Operational Availability, unless defined otherwise in the Contract". |
| Sandia, Hill (SAND2014-18942C, October 2014) | Quotes IEC 61400-26-1: technical availability is "primarily a manufacturer’s view". Operational availability is the operator’s view of the whole system. |
The IEC preview also defines uptime in Section 3.21 and has an annex titled "Energy-based tracking". The sources agree that exclusions are the dividing line. They do not agree on "technical". Two treat it as all-downtime uptime. The wind-turbine standard calls it a manufacturer’s view.
Sandia (Section 4.2.3) quotes one contract. Its guarantee is "the amount of time that the Facility will be able to produce electricity when adequate solar resource is available". That is a time test with a sun condition.
How is availability calculated: time-based or energy-weighted?
Time-based counts hours. Energy-weighted counts expected energy. So a noon outage costs more than one at 07:00. Both use the same sunlit window.
- Set the window. Use hours where plane-of-array (POA) irradiance is above the cut-off. Sandia (Section 4.2.6) found cut-offs of 50 to 100 W/m2 in the contracts it reviewed. Most were near 50. The cut-off skips times when light is too weak to start an inverter.
- Time-based, per component. Use 1 minus downtime ÷ window time (Sandia Eq. 1). Each interval is up or down.
- Plant level: average the components. Weight each by the nameplate power behind it (Sandia Eq. 2).
- Energy-weighted: weight each interval by irradiance or expected energy. Sandia’s Section 5.7.2 notes that raw availability treats an 08:00 outage like a noon outage. Soltell gives each day the same weight in its time-adjusted version. Its energy-adjusted version weights days by energy. It needs weather data.
- Apply the exclusions (next section). Then compare with the guarantee.
The cut-off needs sunlight data. Get it from a pyranometer or, in some tools, a satellite. Performance is a separate matter. See performance ratio.
What do contracts exclude from availability?
Exclusions are events outside the contractor’s control. Lists differ. So name grid outages and curtailment in the contract. Do not assume them.
Sandia’s Section 4.2.7 lists grid disturbances and outages. It also lists owner acts and omissions, and force majeure. Some contracts also exclude warranty periods. Some exclude servicing time. Section 5.5 says time lost to a slow manufacturer should stop the clock.
One published template is Appendix H, Exhibit G-1 of the 2021 ELL Solar RFP on the Entergy RFP site. It counts 10-minute intervals when site POA irradiance is above 100 W/m2. It scores each inverter zone from its inverter station and weights zones by AC nameplate. Its six exclusions are:
- force majeure.
- major equipment defects after warranty.
- construction defects after warranty.
- snow or ice on the array.
- spare parts (not consumables or routine minor parts) that the manufacturer cannot supply or that were not procured.
- missing or flawed data.
The words "grid", "curtail" and "outage" do not appear in the exhibit text. An owner who wants them excluded must add them. The count of valid intervals (n) leaves out excluded ones. So they shrink the denominator. The other treatment counts excluded intervals as available and keeps the denominator. The example below shows the gap is small here.
Worked example: one month, five readings
All inputs are example. The plant has four equal inverters. It runs 30 matching days. The window is the 12 hours a day above an example 100 W/m2 cut-off. That gives 360 plant-hours. Expected energy is irradiance summed over those hours. That is 6,450 W/m2·h a day, or 193,500 a month.
Four example events hit the same month, on different days. Only event B is excluded.
| Event (example) | Plant-hours lost | Share of window time | Share of expected energy | Treatment |
|---|---|---|---|---|
| A: inverter 2 fault, 09:00 to 15:00 (25% of plant, 6 hours) | 1.50 | 0.42% | 0.58% | Counts |
| B: grid outage, 11:00 to 14:00 (100% of plant, 3 hours) | 3.00 | 0.83% | 1.31% | Excluded |
| C: inverter 3 fault, 07:00 to 10:00 (25% of plant, 3 hours) | 0.75 | 0.21% | 0.13% | Counts |
| D: curtailment to 50%, 10:00 to 15:00 (50% of plant, 5 hours) | None | None | 1.03% | Counted only in the last row |
Plant-hours lost = share of plant × hours. Events B and C both last 3 hours. But C hits one inverter in weak morning light, so it costs 0.13% of expected energy, against 1.31% for B.
| Reading | Calculation | Result |
|---|---|---|
| Technical, time-based | 1 − (1.50 + 3.00 + 0.75) ÷ 360 | 98.54% |
| Technical, energy-weighted | 1 − 3,915 ÷ 193,500 | 97.98% |
| Contractual, time-based | 1 − 2.25 ÷ (360 − 3.00) | 99.37% |
| Contractual, energy-weighted | 1 − 1,385 ÷ (193,500 − 2,530) | 99.27% |
| Energy-based, all losses counted | 1 − (3,915 + 1,990) ÷ 193,500 | 96.95% |
The energy-weighted technical reading misses an example 98% guarantee by 0.02 points. Exclude the grid outage and the month reads 99.27%. If the contract counts excluded intervals as available instead of removing them, the contractual readings become 99.38% and 99.28%. As a side check, not a sixth reading, count the plant as available while any inverter runs. Only event B stops every inverter, so the result is 1 − 3.00 ÷ 360 = 99.17%.
Curtailment is not downtime. The plant can still produce. Only the last row counts it. The model is a simple proxy. Irradiance stands in for energy. The model ignores clipping, temperature and day-to-day weather. Clipping can make a midday loss smaller than the proxy shows. See inverter clipping.
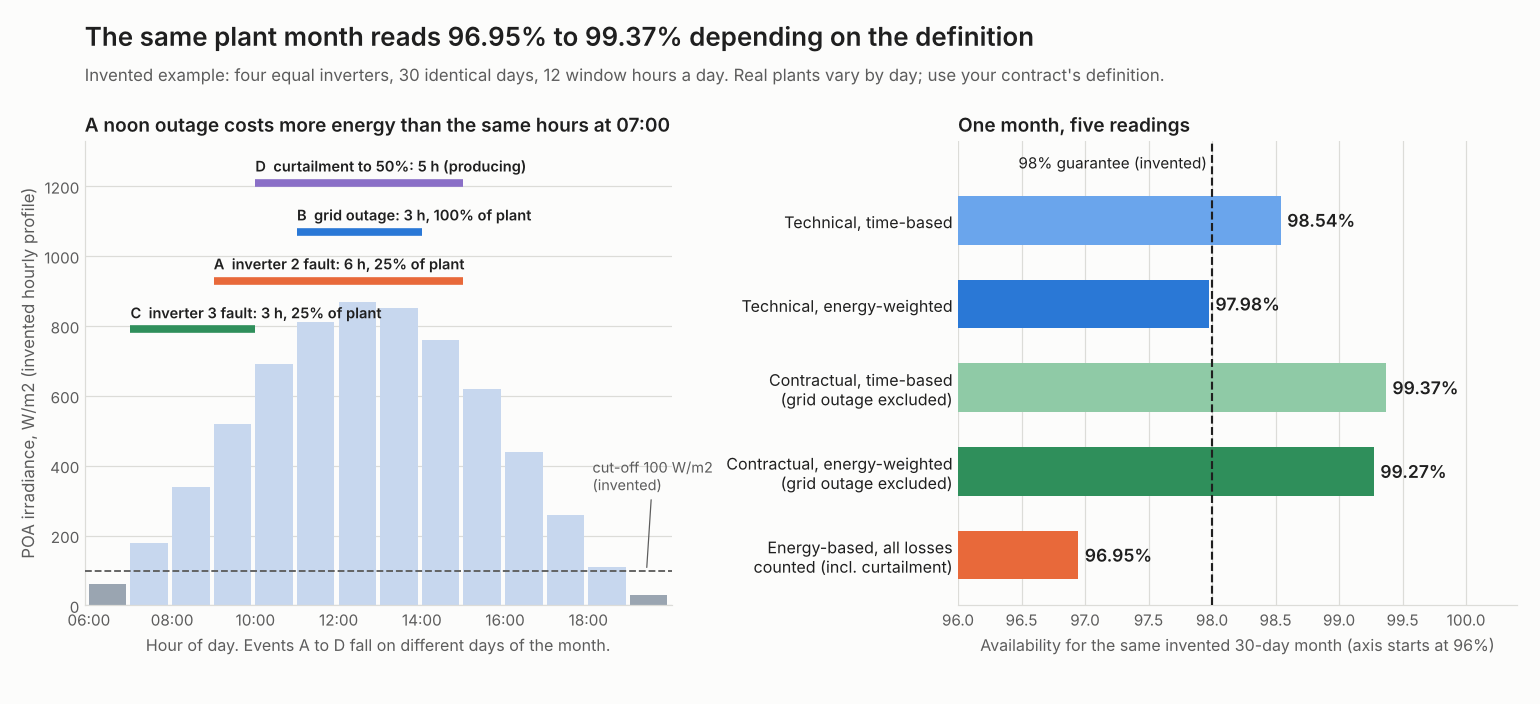
Figure 1. On an example month, one set of events reads between 96.95% and 99.37%, depending on weighting and exclusions.
Check your own month
Enter an hourly irradiance profile. Then add a list of events. It returns the readings above. It loads the example first.
How solar software handles availability
All four tools that document a figure test for production, but they differ on basis, cut-off and weighting. VCOM and GreenPowerMonitor let you exclude events. No help page read prints a technical vs contractual split.
| Software | Documents an availability figure? | Exclusions |
|---|---|---|
| meteocontrol VCOM | Yes | Yes |
| GreenPowerMonitor (DNV) | Yes | Yes |
| Solytic | Yes | Not stated |
| SolarEdge monitoring (ONE for C&I) | Yes | Not stated |
| AlsoEnergy PowerTrack | Not stated | Not stated |
Not stated: the company page we cite does not say. For AlsoEnergy PowerTrack, the two pages read do not document an availability figure, a basis or a cut-off.
Basis, cut-off and exclusion wording from each company page:
- meteocontrol VCOM, definition. "System availability is the percentage of a system that is available over a period of time."
- meteocontrol VCOM, basis. By default the whole system is available or not in each interval. It reads 100% if energy is not 0. Only intervals with POA above 100 W/m2 count. The KPI editor offers system or inverter level. It offers irradiance weighting. It also offers sensor or satellite irradiance.
- meteocontrol VCOM, exclusions. "You can exclude intervals from the PR and system availability calculations via a ticket."
- GreenPowerMonitor (DNV), definition. Availability "expresses the proportion of time that a system is actively producing energy at or above its minimum operational threshold".
- GreenPowerMonitor (DNV), basis. Power and irradiance must be above configured minimums. No values are given. Weighting is optional. Irradiance is the default. Multi-device values use peak power.
- GreenPowerMonitor (DNV), exclusions. Users can enter exceptions. An exception removes a period, such as operator curtailment.
- Solytic. Site availability is the mean of inverter availability for the day. It is hourly. It counts from 2 hours after sunrise to 2 hours before sunset. A site reads 100% when average hourly inverter yield is above 5 Wh. Exclusions are not stated, other than periods marked "Not evaluated".
- SolarEdge monitoring (ONE for C&I). "Measures the percentage of time that the solar PV system is operational and producing energy." It is time-based. The ratio is operational time ÷ expected operational time. No cut-off is stated.
Three VCOM help pages print last-modified dates from 22 July to 22 September 2026, confirmed live in November 2026. The GreenPowerMonitor and Solytic pages cited here no longer load as of November 2026, so their quotes could not be re-checked this pass. Check each company’s current help centre before relying on that wording. The SolarEdge note is version 1.0, August 2024. The two AlsoEnergy pages are dated 1 September 2024 and undated, both confirmed live in November 2026. Ranked options are in best solar monitoring software.
Common mistakes with availability
FAQs
What is the difference between uptime and availability?
Uptime counts every hour of downtime, whatever the cause. Availability applies exclusions. The O&M guide v3.0 draws this line, and some sources call the all-downtime figure technical.
Is a grid outage excluded from availability?
Only if the contract lists it. Sandia lists grid disturbances and outages among its exclusions. The Entergy exhibit does not name them in its text, so check the wording.
Does curtailment reduce availability?
Curtailment is not downtime, and whether it counts depends on the contract. IEC TS 63019 defines availability as capability, whatever the capacity level, so a curtailed plant can still count as available. An energy-based contract can still count the loss, and an exclusion would remove it. The IEC preview we read does not cover curtailment text.
Does availability include trackers and strings?
Some contracts do. The Entergy exhibit counts failed strings, trackers and combiner boxes in each zone. NLR (formerly NREL) published a daily uptime method for single-axis trackers in 2018.
Related terms
- O&M: the service contract that carries the guarantee.
- Performance ratio: output against what the weather allowed.
- Curtailment: output limited by the grid operator.
- Alerts and alarms: the rules that flag a down device.
Next step: to see which monitoring tools report availability and allow exclusions, read the best solar monitoring software list.
Sources
- Sandia SAND2015-10223, Klise and Balfour, November 2015.
- Sandia SAND2014-18942C, Hill, 23 October 2014.
- IEC TS 63019, edition 1.0, 2019-05: iTeh abstract and VDE preview.
- SolarPower Europe guide v3.0, 2018. This Autarco-hosted copy no longer resolves as of November 2026. Autarco’s own site now redirects to invrida.com, so the host has likely changed. Check SolarPower Europe’s own site for a current copy before citing the quote.
- Soltell article, 22 December 2022.
- Entergy RFP site, Appendix H, Exhibit G-1, 2021 ELL Solar RFP.
- meteocontrol help: chart, KPI editor, KPI editor page.
- GreenPowerMonitor help, undated.
- Solytic knowledge base, undated.
- SolarEdge ONE for C&I note, version 1.0, August 2024.
- AlsoEnergy: PowerTrack page, undated. What’s New, 1 September 2024.
- NLR (formerly NREL) tracker uptime paper, 2018.
All sources were checked in October 2026. Last updated 30 October 2026. Next scheduled review: 30 January 2027.