Key takeaways
- NLR (formerly NREL, March 2014) defines it as "a reduction in the output of a generator from what it could otherwise produce given available resources".
- NLR says definitions vary, and an NLR preprint prefers "unused PV output", so confirm which one your contract uses.
- EIA (30 October 2023) names two causes: congestion and oversupply. It says "In CAISO, curtailment is largely a result of congestion."
- In an example 12 MWdc plant, 4.37% of available energy is curtailed. Specific yield falls from 1,805 to 1,726 kWh/kWp.
- LBNL’s 2024 edition models a hypothetical CAISO tracking project (AC basis). It gets a 28.7% capacity factor for 2023. Without curtailment it says 29.6%.
To model curtailment in software, see the best solar simulation software list, or the best solar performance analytics software list for monitoring and PPA reporting.
Curtailment at a glance
Curtailment is energy that was available but not sold. The available figure is a what-if. Someone estimates it. Nobody meters it.
| Item | Detail |
|---|---|
| Formula | Curtailed energy = available energy minus delivered energy. A CAISO daily report (5 March 2017) says: "Curtailment is defined as the difference between actual production and the forecast." |
| Unit | MWh, or a share of available energy. LBNL’s rates are ISO-wide, relative to total solar production. |
| Where it matters | Offtake and PPA payments, net energy estimates, availability and performance reports, and capacity factor comparisons. |
| Standard or rule | No single definition. NLR (2014) says definitions vary. An NLR preprint proposes counting only "unused PV output". |
| In software | Design and simulation tools take a limit or a time series. Monitoring platforms mostly let you leave out a period. |
Why does curtailment matter for installers and plant owners?
You cannot sell cut energy, so it lowers pay and yield. NLR’s 2015 duck-chart briefing says it "means less can be sold". It also raises the cost of added PV.
It reaches design too. A site export cap can change the inverter and battery you pick. See grid-connected systems, solar-plus-storage and hosting capacity maps.
What causes solar curtailment?
The sources name three grid-side causes (congestion, oversupply and system security). The table adds a fourth row, a site export limit. The mix depends on the market and the year. These sources are from the US. NLR’s 2014 examples are mostly wind.
| Cause | What it means | Source, market and date |
|---|---|---|
| Transmission congestion | "Congestion, when power lines don’t have enough capacity to deliver available energy". | EIA, California (CAISO), 30 October 2023. NLR (March 2014): the most common reason for US wind curtailments to date. CAISO category "Economic - Local". |
| Oversupply | "Oversupply, when generation exceeds customer electricity demand". Low-load periods can push baseload plants to minimum output. | EIA, CAISO, 30 October 2023. NLR (March 2014). CAISO category "Economic - System". NLR (November 2015): "Too much supply, not enough demand". |
| System security, voltage, frequency | Cuts for voltage reasons in weak parts of the grid. Frequency and stability can be an issue on small or isolated grids. | NLR (March 2014), with ISO-NE and Hawaii as examples. |
| Site or interconnection limit | A cap on AC power the system may deliver. SAM treats "any power above the limit" as curtailed. | SAM help, "Grid Limits" (NLR, undated). |
CAISO’s report says congestion occurs when "available, least-cost energy cannot be delivered to some loads". Its other types are exceptional dispatch and self-schedule cuts. For grid access, see interconnection queue. For the software that sends the orders, see DERMS.
How is curtailment different from inverter clipping?
Clipping happens because the array is bigger than the inverter. Curtailment happens because something outside the plant caps its delivery. Both can flatten the power curve.
| Inverter clipping | Curtailment | Fault or outage | |
|---|---|---|---|
| What limits output | The inverter’s AC rating, set at design. | An outside limit: operator order, price signal or export cap. | Equipment that is not working. |
| Could the plant make more? | Not without more inverter capacity. | Yes. It is able to produce. | Not until repaired. |
| Detail | Inverter clipping | This page. | Availability |
Models blur the line. PVsyst says the grid limit "will always be managed by the inverter as a clipping loss". It then books the loss as "Inverter loss over nominal power". You can tick "Account as separate loss" to change that. See loss diagrams.
How do models and monitoring record curtailment?
They record it as a gap. One side is what the plant could have made. The other is what it sent out. The first number is a model or forecast. Two parties can differ on it.
- Yield models: SAM applies a limit or a curtailment time series at each time step. Its results list "Annual energy loss from curtailment limit". They also list "System power before curtailment limit". The cash flow shows the revenue effect (SAM help, undated). See how this fits a full run in energy yield simulation.
- Market reports: CAISO’s daily report (5 March 2017) lists curtailed MWh by hour. It splits them by type, reason and fuel. LBNL gets ERCOT data from plant reports. For CAISO it splits out ISO-level reports.
- Performance reports: LBNL’s degradation model adds curtailment back into "actual" capacity factor in CAISO and ERCOT. A reader needs to know whether a yield or specific yield figure is before or after the cut.
How does curtailment enter contracts and revenue?
The contract decides who bears the loss. NLR (March 2014, Section 4.3) says compensation for curtailed energy is "typically negotiated and stipulated in PPAs". In some wholesale markets it says economic curtailment gets no pay. A bilateral PPA can change that. Some PPAs set an annual curtailment quota. The off-taker pays only past that quota.
The report also says a cut costs plants on the production tax credit twice. They lose the credit and the energy value. It says this loss is higher than for plants on the investment tax credit. That was its 2014 view, not a current rule. In SAM’s Single Owner and Merchant Plant models, you enter a "curtailment compensation rate". It pays for cut power. For payment terms, see power purchase agreement.
Worked example: available vs delivered energy
All inputs are example. A 12 MWdc plant has a 10 MWac inverter rating. DC-to-AC efficiency is 90%. Each day is a half-sine curve from 06:00 to 18:00. Available means after clipping and before the grid limit. The price is an example 45 USD per MWh.
Only the two limited day types lose energy. The other days lose none.
| Day type (example) | Days and grid limit | Available, MWh | Delivered, MWh | Curtailed, MWh |
|---|---|---|---|---|
| Clear day, no limit | 150 days. No limit | 11,739 | 11,739 | 0 |
| Spring oversupply limit | 30 days. 4 MW (40% of 10 MWac), 10:00 to 16:00 | 2,284 | 1,444 | 840 |
| Congestion limit | 20 days. 7 MW (70% of 10 MWac), 12:00 to 15:00 | 1,489 | 1,383 | 107 |
| Cloudy day, no limit | 165 days. No limit | 6,144 | 6,144 | 0 |
| Year (365 days) | 365 days | 21,656 | 20,709 | 946 |
Energy is rounded to whole MWh, so rows may differ from the total by 1 MWh. Delivered is 95.63% of available. Clipping (52 MWh) is a separate loss. The example does not count it as curtailed.
| Measure (example plant) | Before the limit | After the limit | Change |
|---|---|---|---|
| Specific yield, kWh/kWp (AC energy over 12 MWdc) | 1,805 | 1,726 | -79 |
| Capacity factor, AC basis (10 MWac, 8,760 hours) | 24.72% | 23.64% | -1.08 points |
| Capacity factor, DC basis (12 MWdc, 8,760 hours) | 20.60% | 19.70% | -0.90 points |
Yield fell 79 kWh/kWp because 946 MWh was not sent out. DC-basis capacity factor is specific yield divided by 8,760 hours. See capacity factor. If a benchmark leaves out the cuts, compare it with the "before" column.
| Contract treatment (example terms) | Revenue, USD | Revenue lost against available, USD |
|---|---|---|
| Curtailed energy not paid | 931,921 | 42,586 |
| All curtailed energy paid at the full price | 974,507 | 0 |
| First 100 MWh a year not paid, the rest paid in full | 970,007 | 4,500 |
Revenue is worked from unrounded energy, so it can differ slightly from rounded MWh times the price. Revenue on all available energy is 974,507 USD at the example price. Real pay formulas differ. Prices change by hour. This example uses one flat price.
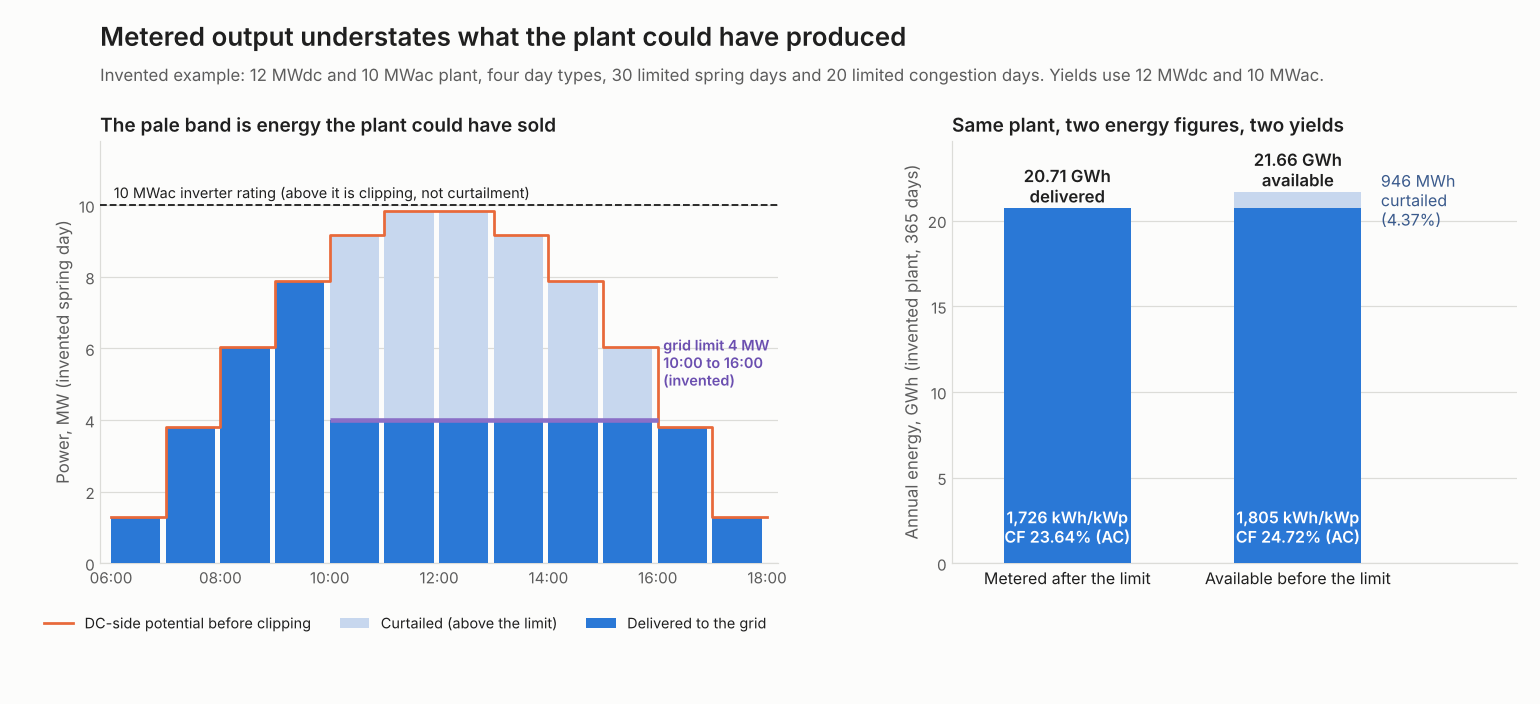
Figure 1. In an example plant, a grid limit on 50 of 365 days cuts annual energy by 4.37% and shifts yield and capacity factor with it.
Check your own schedule
Enter plant size, efficiency, price, a pay rate and a list of day types. It returns energy, yield, capacity factor and revenue. It shows one contract treatment at a time. It loads the example first.
How solar software handles curtailment
SAM, PVsyst and Aurora Solar document a limit setting, GreenPowerMonitor only lets you remove a period from availability, and meteocontrol VCOM does not mention curtailment. The table records the help pages as read in October 2026.
| Software | Models or records curtailment? | Page read |
|---|---|---|
| SAM | Yes | SAM help, "Grid Limits", undated. |
| PVsyst | Yes | PVsyst help, "Grid power limitation", no date printed. Mentions version 7.3. |
| Aurora Solar | Yes | Aurora help, "Using Grid Export Limits", undated. |
| GreenPowerMonitor (DNV) | Partly | GPM+ help, "Availability", undated. |
| meteocontrol VCOM | Not stated | VCOM help, KPI editor page, last modified 22 July 2026. |
Yes means the help page says so. Partly means it covers only part of the topic. Not stated means the page we cite does not say.
- SAM. A grid interconnection limit in kWac and a curtailment time series. Result variables show annual curtailment loss and power before the limit. Single Owner and Merchant Plant models pay for curtailed power at a set rate.
- PVsyst. A grid power limit in kW or kVA, set under "Energy Management". The loss is a clipping-type loss, with a separate "EGrdLim" loss if the option is ticked.
- Aurora Solar. A "Grid export limit" setting in Design Mode. Production above the limit shows as a curtailed band in the energy chart, and annual summaries include total curtailed energy. No separate loss line is mentioned.
- GreenPowerMonitor (DNV). Does not report curtailed energy on the page read. Users can enter exceptions that remove a period from availability. One example is a grid operator curtailment request.
- meteocontrol VCOM. The page lets you exclude intervals from PR and availability through a ticket. It does not mention curtailment.
To compare design and yield tools, see the best solar simulation software list.
Common mistakes with curtailment
FAQs
Is curtailment the same as inverter clipping?
No. Clipping comes from the plant’s own AC rating. Curtailment is an outside limit. The plant could make more. Some models, such as PVsyst, still book a grid limit as a clipping-type loss.
Who pays for curtailed solar energy?
The contract decides who pays. NLR (March 2014) says pay for cut energy is typically negotiated in the PPA. Some PPAs set an annual quota before the off-taker pays, so the pay clause matters.
Does curtailment count against availability?
Only if the contract says so. GreenPowerMonitor’s help lists a grid operator request to cut output, and you can remove that event from availability. Your contract’s definition decides. See availability.
How much curtailment should a plant expect?
It varies by grid and year, and these sources cannot say for one plant. LBNL’s 2024 edition reports 3.0% in CAISO and 7.3% in ERCOT for 2023, ISO-wide, against total solar production. It says most ERCOT cuts happen in west Texas. Grid studies for your own market give a better guide.
Can a battery reduce curtailment?
It can store energy that would be cut. Aurora’s help says surplus above an export limit is "stored in available battery capacity". If it will not fit, it is curtailed. See solar-plus-storage.
Related terms
- Inverter clipping: energy lost above the inverter’s AC rating.
- Capacity factor: energy sent out against full-power hours.
- Availability: the share of time a plant can run.
- DER: small generators and batteries on the local grid.
- Interconnection queue: the line of projects waiting to connect.
- Solar power forecasting: predicting plant output for a coming period.
Next step: find the curtailment clause in your PPA and test it in the calculator above with your own day types. To track real cuts, compare the best solar performance analytics software.
Sources
- EIA Today in Energy, solar and wind cuts in California, 30 October 2023. Checked 30 October 2026.
- NREL/TP-6A20-60983, Bird, Cochran and Wang, US wind and solar curtailment, March 2014.
- NREL/PR-6A20-65453, Denholm et al., duck chart field guide, November 2015.
- NREL/CP-6A20-74176, solar PV curtailment preprint, no date in the record.
- LBNL, Utility-Scale Solar, 2024 edition, October 2024 (slides). Checked against the full PDF text in November 2026.
- CAISO daily curtailment report, 5 March 2017. Checked 30 October 2026.
- SAM help, Grid Limits, undated.
- PVsyst help, Grid power limitation, undated.
- Aurora help, Using Grid Export Limits, undated.
- GreenPowerMonitor help, Availability, undated.
- meteocontrol VCOM help, KPI editor, last modified 22 July 2026.
Last updated 30 October 2026. Next scheduled review: 30 January 2027.