Key takeaways
- NREL’s guide (3rd edition, December 2018) says asset management includes all O&M services and adds business tasks.
- This example’s 5 MWdc plant came in 515,000 kWh (7.61%) under budget: sunlight 270,600 kWh, availability 118,080 kWh, residual 126,320 kWh.
- Only 0.4 point of the 1.8-point availability gap falls under an example 98% guarantee. That slice is 26,240 kWh, about 1,574 USD at 0.060 USD per kWh.
- The split depends on method: taking availability first moves 4,920 kWh, and a sunlight sensor reading 2% high lifts the residual to 253,846 kWh.
- Of five tools, one documents a budget comparison, one documents contract tracking and three document reports.
To compare tools that track budgets, contracts and owner reports, see best solar asset management software.
Solar asset management at a glance
This work asks if the investment is on plan. O&M asks if the plant is running. The owner or a hired manager does the first.
| Item | Detail |
|---|---|
| Core jobs | Performance against budget, contracts and warranties, money administration, reporting, O&M oversight. |
| Core measures | Energy and revenue against budget, availability, performance ratio, cost against budget. |
| Where it matters | Owner returns, lender and investor reports, PPA invoicing, warranty claims, O&M contract disputes. |
| Standard or rule | No single standard. NLR (formerly NREL) and SolarPower Europe publish guides. The owner’s contracts set the duties. |
| In software | Monitoring platforms with budget and report modules, field service tools and portfolio finance tools. |
Why does asset management matter for installers?
Owners compare output with a budget. Poor handover data means a poor first report. See handover pack and commissioning. If you hold the O&M contract, the owner’s manager will compare your availability with the guarantee (this example’s plant: 98.0% guaranteed, 97.2% actual). They will also test your response times.
What does a solar asset manager do?
An asset manager protects the owner’s return. That covers the whole life of the plant. Five jobs recur in the sources below.
| Job | In practice | What the sources say |
|---|---|---|
| 1. Performance against budget | Compare energy and revenue with the budget and explain the gap. | NLR (formerly NREL) lists "performance reporting". GPM Horizon’s page describes checking production and revenues against budgets. |
| 2. Contracts and warranties | Know what each contract promises and when to claim. | NREL lists "enforcement of warranties". A 2020 pv-tech article lists "contract management and administrative optimisation". |
| 3. Money administration | Bill offtakers, manage reserves, keep insurance current. | NREL lists billing and collections from PPAs and leases, "management of budget and reserves" and insurance. |
| 4. Reporting | Give the owner and other parties regular reports. | SolarPower Europe’s version 3.0 says report frequency can run from daily to annual, "monthly being the most common". |
| 5. O&M oversight | Check the contractor’s work and results. | The pv-tech article lists "O&M site activity supervision, covering the full traceability of all maintenance completed for the plant". |
NREL says it "is a systematic process of planning, operating, maintaining, upgrading, and replacing" the asset. SolarPower Europe’s guide says it "aims at ensuring optimal profitability of the PV power plant (or a portfolio of plants)". It adds that "asset Managers report to asset Owners".
How is asset management different from O&M, a CMMS and monitoring?
Each layer answers its own question. This work sits on top. It uses the others as inputs.
| Layer | Question it answers | Usual owner of the work |
|---|---|---|
| SCADA and fleet monitoring | What is the plant doing now? | Operator or monitoring team |
| O&M | Is the plant kept running to the contract? | O&M contractor |
| CMMS | What was repaired, with which part, and how fast? | O&M contractor |
| Asset management | Is the investment on plan, and who is responsible if not? | Owner or hired asset manager |
The roles can merge. SolarPower Europe’s guide says the O&M contractor often takes on the technical side. The asset manager then holds the commercial and admin duties. Alert rules are on alerts and alarms.
How do you explain a budget variance?
Split the gap between budgeted and actual energy. Use three parts. They are sunlight, availability and a residual. What is left over is a question. It is not a cause.
- Write down the budget’s basis: sunlight, performance ratio and availability. A budget from an energy model may be a P50 figure.
- Measure actual sunlight on the same basis as the budget.
- Irradiance effect = budget energy × (actual sunlight ÷ budget sunlight − 1).
- Availability effect = energy at 100% availability × the change in availability. Use the budget’s own definition. See availability and O&M.
- Residual = actual − budget − steps 3 and 4. Then look for causes. They include soiling, curtailment, degradation, heat and equipment faults.
The order matters a little, because the two effects overlap. State the order you used. For day-by-day checks against a model, see expected vs actual production.
Worked example: a 5 MWdc plant, one year
This example’s plant fell 515,000 kWh short of budget. Sunlight explains 52.5% of that. Availability explains 22.9%. The rest is 24.5%. Every input is example.
| Input (example) | Value |
|---|---|
| Size | 5,000 kWdc |
| Budget | 1,650 kWh per m² in the plane of array, performance ratio 82.0% (includes budgeted availability), availability 99.0% |
| Actual | 1,584 kWh per m² (4.0% below budget), availability 97.2% on the same definition, 6,250,000 kWh at the meter |
| Price and contract | 0.060 USD per kWh, flat. Availability guarantee 98.0%. 0.4 point of downtime excluded under the contract (grid outage) |
| Step | Working | kWh | Share of budget |
|---|---|---|---|
| Budget energy | 5,000 × 1,650 × 0.82 | 6,765,000 | 100% |
| Irradiance effect | 6,765,000 × (1,584 ÷ 1,650 − 1) | −270,600 | −4.00% |
| Availability effect | 1.8 points × 65,600 kWh per point | −118,080 | −1.75% |
| Residual | 6,250,000 − 6,376,320 | −126,320 | −1.87% |
| Total | 6,250,000 − 6,765,000 | −515,000 | −7.61% |
At 0.060 USD per kWh the total is 30,900 USD. The 65,600 kWh per point comes from one step. Divide the energy at 100% availability at actual sunlight (6,560,000 kWh) by 100.
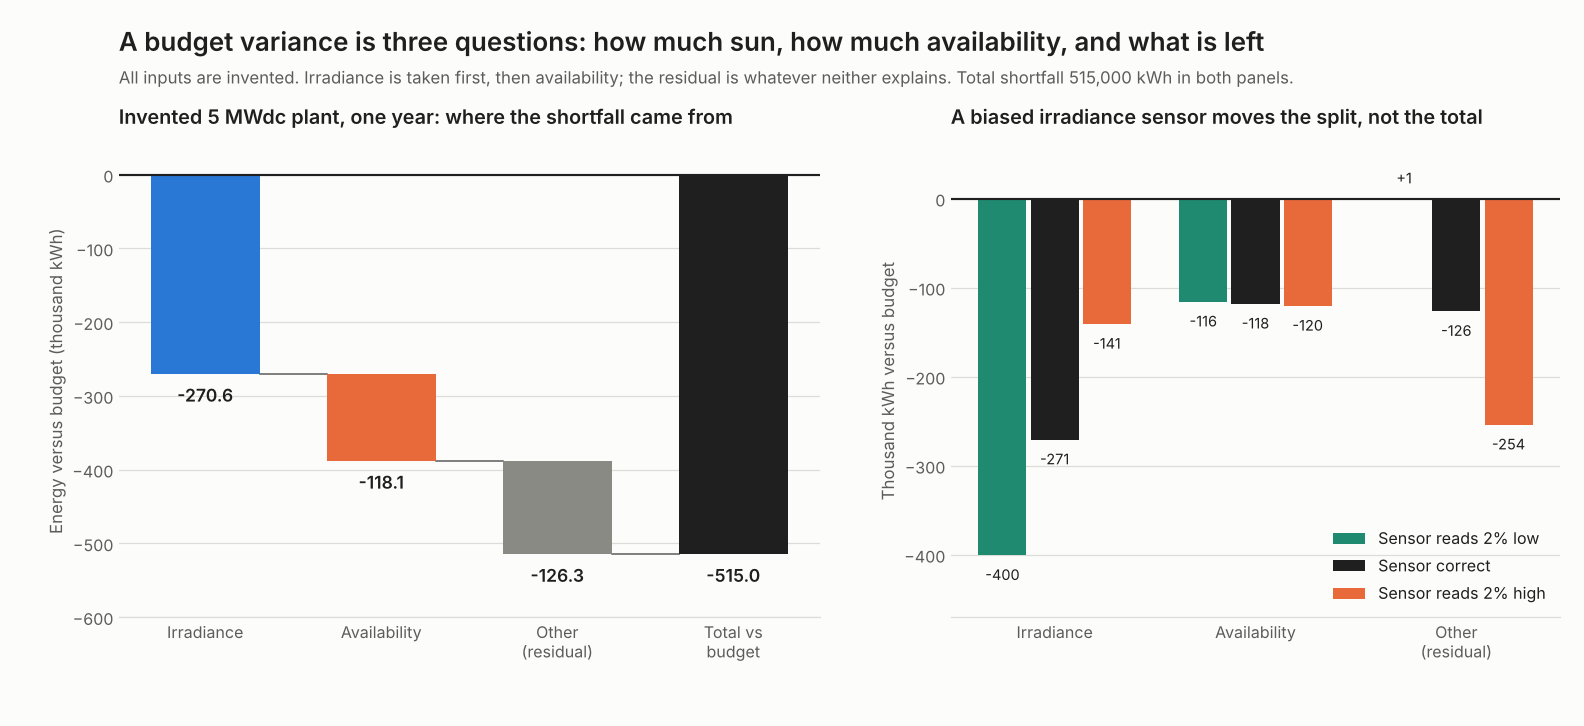
Figure 1. On this example’s plant sunlight explains about half the shortfall, and a biased sunlight sensor can move that share.
Taking availability first gives −265,680 kWh for sunlight. Availability gets −123,000 kWh. The residual stays at −126,320 kWh. The order shifts 4,920 kWh.
The sensor matters more. Say the plane-of-array sensor reads 2% high. Then the plant reports 1,615.68 kWh per m². Sunlight explains only −140,712 kWh. The residual grows to −253,846 kWh. A sensor reading 2% low leaves a residual of +1,206 kWh. Same plant, same meter. Different story.
| Part of the 1.8-point availability gap | Points | kWh | Can the owner claim it? |
|---|---|---|---|
| Budget set above the guarantee (99.0 − 98.0) | 1.0 | 65,600 | No. The contract only promises 98.0%. |
| Excluded downtime (grid outage) | 0.4 | 26,240 | No, under the contract’s exclusions. |
| Below the guarantee after exclusions | 0.4 | 26,240 | Yes, subject to the contract’s own formula. |
Only 22.2% of that effect falls under the guarantee. At our price, that is 1,574 USD. Real remedies follow the contract’s own formula. Our shortcut is lost energy times price. The gap between budget and guarantee is a budgeting choice. Check that the two match. Contract terms are on the O&M page.
Budget variance calculator
Enter your own budget, sunlight and meter data. The presets repeat the tables above and the sensor case.
All inputs are assumptions you set. If the calculator does not load, open the budget variance calculator on its own page.
How solar software handles asset management
Only GPM Horizon fully documents a budget comparison, and only Unity fully documents contract and warranty tracking. Three of the five document reports. Company pages were checked October 2026.
| Software | Budget comparison | Contracts and warranties | Reports |
|---|---|---|---|
| GreenPowerMonitor (GPM Horizon) | Yes | Not stated | Yes |
| Power Factors Unity | Not stated | Yes | Partly |
| AlsoEnergy PowerTrack | Not stated | Partly | Yes |
| meteocontrol VCOM Cloud | Partly | Not stated | Yes |
| Sitetracker | Partly | Not stated | Not stated |
Not stated: the company page we cite does not say. Partly: the page covers only part of the job. The company pages we read show no date.
What each company page says:
- GreenPowerMonitor (GPM Horizon). Budget: "Evaluate your production and revenues against precise budgets, taking into account losses from multiple sources." Reports: "Build asset performance reports within minutes." Source: GPM Horizon solar page.
- Power Factors Unity: Budgets are not mentioned. Contracts: "Entitlement and warranty tracking by asset and work type". Reports: "Auditable service histories for compliance and reporting". Source: Unity Field Service Management page.
- AlsoEnergy PowerTrack: Contracts: "Centralized document management". The warranty terms named are for AlsoEnergy’s own edge products. Reports: "Portfolio-level financial reports, charts, and invoicing". Source: AlsoEnergy All-in-One Asset Management page.
- meteocontrol VCOM Cloud: Budget: "Comparison of target/actual values – simulation of the target value". Budgets are not mentioned. Reports: "Investor view with key performance indicators, approved tickets and documents". Source: VCOM Monitoring page.
- Sitetracker: Budget: "tools for job costing, invoicing, and budget management". No budget-to-actual comparison is stated. "Agreement Management" and "Reporting & Analytics" appear only as navigation links. Source: Sitetracker Operations and Maintenance page.
Company pages describe features. None states how a variance is split, so confirm the method before you rely on a number. Ranked options are in best solar asset management software and best solar monitoring software.
Common mistakes with asset management
FAQs
Is asset management the same as O&M?
No. NLR (formerly NREL) says asset management contains all O&M services and adds business services. So O&M is one part. The contractor keeps the plant running. The asset manager checks the result against budget and contracts.
Who does solar asset management?
The plant owner does it, or hires an asset manager to do it. The technical side often goes to the O&M contractor, so the manager keeps the commercial duties. Check who holds each job in your contracts.
What is the difference between technical and commercial asset management?
Technical work covers plant performance and reports. It also covers contract management and O&M supervision (PV Tech). Commercial work covers invoices, reserves and money. The PV Tech article says the technical side "is focused on providing value to the asset owner". The split is a habit. It is not a standard.
How often should an owner get a report?
Monthly is the most common schedule. SolarPower Europe’s guide says reports can be daily, weekly, monthly, quarterly or annual, with "monthly being the most common". Lenders may set their own schedule in the loan papers, so read yours.
Does a large residual mean a fault?
Not by itself. In our example, a 2% sensor error moved the residual. It went from 126,320 kWh to 253,846 kWh. The plant did not change. Check the sensor first. Then check soiling and curtailment.
Related terms
- O&M: contract terms and plant upkeep.
- CMMS: repair records and parts.
- KPI dashboard: business measures.
- Availability: the share of time the plant can produce.
- Performance ratio: energy out compared with what the sunlight allowed.
- Alerts and alarms: rules that turn plant data into messages.
- P50 and other probability levels: the odds behind an energy budget.
Next step: write down your budget’s availability and your contract’s guarantee. Then compare asset management tools for budgets, contracts and reports.
Sources
- NLR (formerly NREL): Best Practices for O&M of PV and Energy Storage Systems, 3rd edition, December 2018, Section 4.
- SolarPower Europe: O&M guidelines, version 3.0, December 2018, Sections 1.3 and 5.1. The Autarco-hosted copy we cited no longer resolves (checked November 2026). Search SolarPower Europe’s own site for the current copy before relying on the quoted wording.
- PV Tech: asset management article, 5 March 2020.
- GreenPowerMonitor: GPM Horizon page, no date printed.
- Power Factors: Unity field service page, no date printed.
- AlsoEnergy: All-in-One Asset Management page, no date printed (re-checked 30 October 2026). An earlier AlsoEnergy page we cited did not carry the quoted text.
- meteocontrol: VCOM page, no date printed.
- Sitetracker: O&M page, no date printed.
All sources were checked in October 2026. Last updated 30 October 2026. Next scheduled review: 30 January 2027.