Key takeaways
- We found no standard that defines "bankable". A 2017 EU project guide gives a 15-item checklist for a long-term yield assessment. It has four groups.
- In this example’s 8.0 MWdc case, five reviewer changes cut a 12,800 MWh design-tool run. The bankable P50 is 12,148 MWh. That is 5.1% lower.
- The example 1-year P90 is 11,354 MWh. That is 11.3% below the design-tool run. Better site data lifts it by about 115 MWh. P50 stays the same.
- PVsyst, SAM, PVcase Yield and Solargis Evaluate (knowledge base only) document P-value outputs. A P-value tool is not an assessment, because you supply the uncertainty inputs.
To compare yield tools that output P-values, see best solar simulation software.
Bankable energy yield at a glance
A bankable estimate is a P50 with the uncertainty, evidence and review that let a lender trust it. The label says how the number was made and checked. The number itself is not a different kind.
| Item | Detail |
|---|---|
| Typical contents | First-year P50 and P90 energy, specific yield, performance ratio with its basis, a loss chain and an uncertainty analysis. SgurrEnergy’s methodology page says its loss chain has around twenty documented loss factors. |
| Who produces it | A specialist. SgurrEnergy says lenders expect a specialist to produce the assessment, or to review it independently. |
| Standard or rule | None found that defines the label. The Solar Bankability project (Horizon 2020, 15 February 2017) published a yield checklist. It is advice, not a lender rule. |
| In software | Tools output P-values from your inputs. No tool makes a result bankable by itself. |
What makes a yield estimate bankable?
A lender or its adviser decides, case by case. The estimate usually has to pass four tests. They are independence, documented inputs, a stated uncertainty and a link to the cash-flow model.
- Independence: SgurrEnergy’s methodology page calls independence the first test. The D4.3 guide says a third party should validate the design. It should also validate the estimated yield (EPC checklist item 15).
- Documented inputs: a reader must see the data, model, assumptions and degradation behind the number. The checklist below shows what D4.3 asks for.
- Stated uncertainty: SgurrEnergy writes: "A yield figure without an uncertainty band is not bankable." The method is on the P50, P90 and P99 page.
- Link to the model: lenders often test debt service on a cautious case such as P90. Solargis staff say so in PV Tech (23 March 2026). They add that lenders do not usually apply a blanket yearly discount. They are a yield-data company, so read this as their view. See debt sizing and DSCR and the project finance model.
Why does bankable energy yield matter for installers and developers?
A loan, investor or guarantee may rest on the energy figure. A bare P50 then gives the reader no uncertainty to test. A bankable report supplies it. Lenders size debt to keep cover above a minimum. The PV Tech article above says so.
Solargis staff say in POWER (18 May 2026) that better evidence can help the conservative case without raising expected yield. Figure 1 shows this.
What should a bankable yield report show?
It should show eight things. Rows 1 to 7 follow the 15 items of D4.3 Appendix 3, "Best Practice Checklist for Long-Term Yield Assessment". Row 8 comes from SgurrEnergy.
| Evidence | What to look for | Source |
|---|---|---|
| 1. Resource data | Source name and version stated. More than 10 years of recent data. Reporting period stated. | D4.3 items A1, A2. IEA PVPS Task 13 (2018) proposes the most recent 10 years as a compromise. |
| 2. Trends and site data | Long-term trends checked. A site measurement campaign of at least 8 months, ideally a full year, to cut uncertainty. | D4.3 items A3, A4. |
| 3. Model | Software name and version stated, including in-house tools. | D4.3 items B5, B6. |
| 4. Assumptions | All assumptions and sub-models stated, for example soiling, availability and the transposition model. | D4.3 item B7. |
| 5. Degradation | Rates stated, first-year effects separated, pattern (linear or stepwise) ideally backed by warranties. | D4.3 items C8 to C10. |
| 6. Uncertainty | Each term stated with references and classed as systematic or variable. Resource terms examined. Reduction methods documented. | D4.3 items D11 to D14. |
| 7. P-values | Computed from the data where possible, not assumed normal for every term. | D4.3 item D15. |
| 8. Headline outputs | First-year P50 in MWh, specific yield, and performance ratio with its basis (plane of array or GHI). | SgurrEnergy methodology page. |
D4.3 was written for investors, banks, insurers and regulators. It is an EU project guide, not a lender requirement. Our example uses a normal distribution for simplicity. A real report computes P-values from the data (row 7).
Worked example: from a design-tool run to a bankable P90
In this example’s 8.0 MWdc plant, five reviewer changes lower a 12,800 MWh design-tool run. The bankable P50 is 12,148 MWh. The 1-year P90 is 11,354 MWh with satellite data only. After about 12 months of site data it is 11,470 MWh.
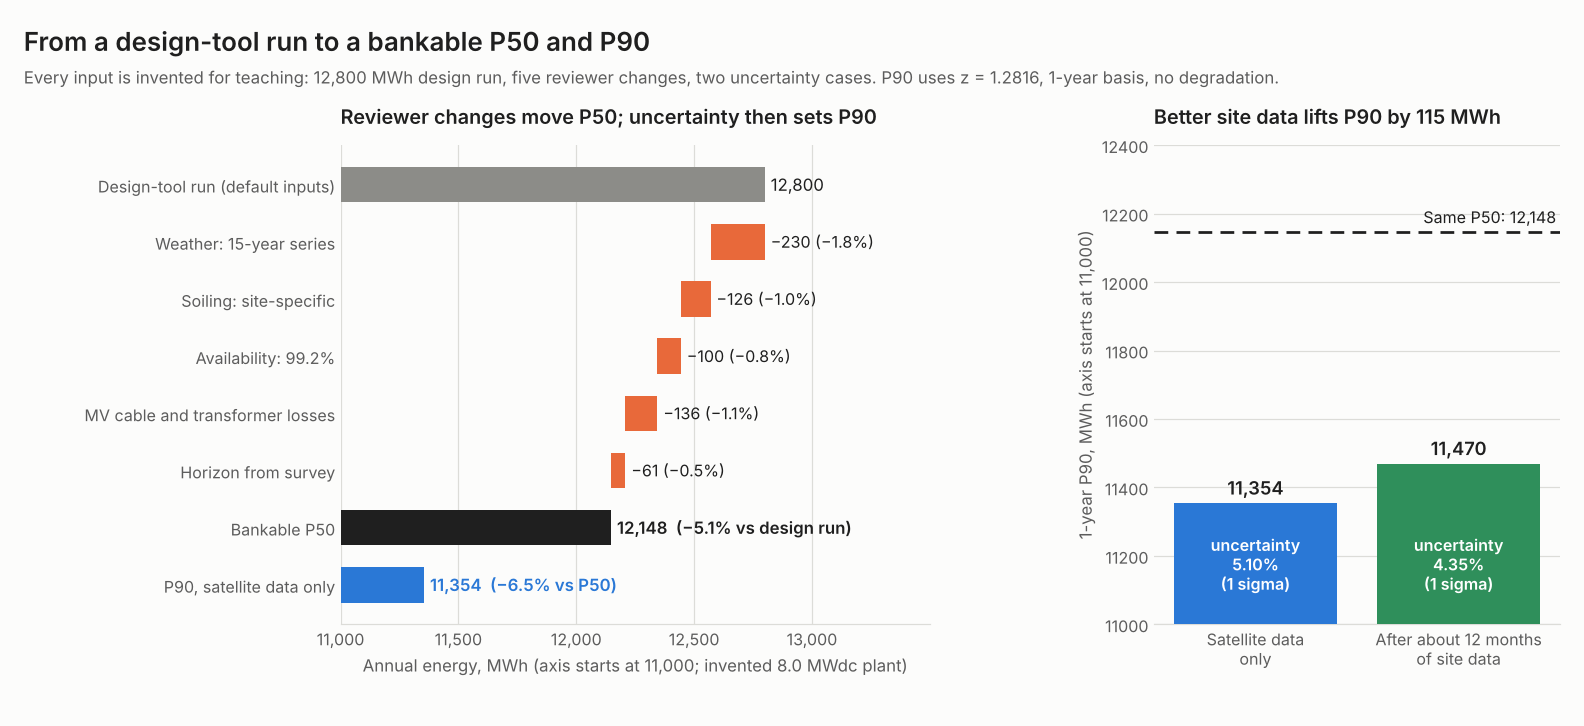
Figure 1. In an example case, five reviewer changes lower P50 by 5.1%. With 12 months of site data, P90 rises by about 115 MWh without moving P50.
| Step (all changes example) | Change to energy | Energy left (MWh) |
|---|---|---|
| Design-tool run (default inputs) | none | 12,800 |
| Weather: 15-year series instead of one TMY year | −1.8% | 12,570 |
| Soiling: site-specific instead of tool default | −1.0% | 12,444 |
| Availability: 99.2% instead of 100% | −0.8% | 12,344 |
| MV cable and transformer losses added | −1.1% | 12,209 |
| Horizon shading from survey instead of default | −0.5% | 12,148 |
Each change applies to the energy left by the one above. They compound to -5.1%. A plain sum gives -5.2%. A reviewer can also move P50 up. Specific yield falls from 1,600 to 1,518 kWh/kWp (example).
| One-sigma term, percent of P50 (example) | Case A: satellite data only | Case B: about 12 months of site data |
|---|---|---|
| Irradiance data | 3.2 | 1.8 |
| Year-to-year weather | 3.0 | 3.0 |
| Transposition to plane of array | 1.2 | 1.2 |
| PV model | 2.0 | 2.0 |
| Soiling estimate | 0.8 | 0.8 |
| Availability | 0.8 | 0.8 |
| Total (root sum of squares) | 5.10 | 4.35 |
| 1-year P90 (MWh) | 11,354 | 11,470 |
| P90 below P50 | 6.53% | 5.58% |
The P90 follows the method on the P50, P90 and P99 page. It uses z = 1.2816, a 1-year basis and no degradation. Only the irradiance term differs. P50 is the same in both cases. P90 rises 1.0%.
SgurrEnergy’s methodology page gives its own, higher figures. It says satellite-derived resource uncertainty is "often 7.5% or higher" and puts inter-annual variability "typically of the order of 5%". These are the company’s statements, not benchmarks. This example’s terms are milder, so use your own.
Calculator: design run to bankable P90
Enter your own design-tool energy, reviewer changes and uncertainty terms. The defaults are the example case A above. The preset buttons reproduce both cases. If it does not load, use the standalone version of the calculator.
How solar software handles bankable energy yield
No tool documents "bankable" as a feature. PVsyst, SAM, PVcase Yield and Solargis Evaluate document P-value output, and PVsyst and PVcase Yield rely on uncertainty inputs you set. Each row below states what its company page says.
| Software | P-values documented? | Page read, date |
|---|---|---|
| PVsyst | Yes | PVsyst help, P50 - P90 evaluations. |
| SAM | Yes, for Detailed PV and PVWatts | SAM help, Uncertainty. |
| PVcase Yield | Yes | PVcase help, Probability estimation. PVcase bankable page (2026 copyright). |
| Solargis Evaluate | Yes (knowledge base) | Solargis knowledge base, updated 22 October 2026. Product page. |
A row with no date means the page prints none. The PVsyst page also prints no version.
What each page says:
- PVsyst. The P50 - P90 tool reads multi-year results as a normal distribution. You enter the uncertainties. The result shows on the report if set. Annual values only. Not for stand-alone or pumping systems.
- SAM. The Uncertainty option needs at least ten one-year weather files. It shows P-values under three graphs. The page does not mention bankability or lenders.
- PVcase Yield. Probability estimation gives P50, P75, P90, P95 and P99 from weather and modelling uncertainties you set (0 to 25 each). Results show on the Results page and in PDF reports. A separate marketing page calls the modelling bankability-grade, names no lender and gives no P-value outputs.
- Solargis Evaluate. The knowledge base says its P50 and P90 approach is used in Evaluate. The product page does not mention P50 or P90. It says reports can support financing and that data is accepted by banks. These are company claims and no lender is named.
Ranked options are in best solar simulation software. For wider design suites, see best solar design software and best utility-scale solar design software. For the finance side, see best solar financial modeling software.
Common mistakes with bankable energy yield
FAQs
Is a PVsyst report bankable?
Not on its own. PVsyst’s P50 - P90 tool works from the uncertainties you enter. SgurrEnergy says lenders expect a specialist to produce or review the assessment. Ask your lender what it accepts. See the PVsyst report page.
What is the difference between P50 and bankable energy yield?
P50 is one expected-case number. A bankable yield adds P90, the uncertainty behind it, the evidence and an independent review. The formulas are on the P50, P90 and P99 page.
Who produces a bankable energy yield assessment?
A specialist yield firm produces it, or a lenders’ technical adviser reviews the P50 and P90 estimates behind debt sizing, according to SgurrEnergy. Partner ESI, an engineering firm, says an independent engineer’s report is usually requested at due diligence and includes a solar resource and kWh production review.
Does bankable mean the plant will hit the figure?
No. By definition about one year in ten falls below the P90, and the P50 behind it can be wrong. PVGIS is a free yield tool that can sanity-check a design. It is not an independent assessment. The energy yield simulation page explains the loss chain.
Related terms
- P50, P90 and P99: yield levels met in 50%, 90% and 99% of years.
- Energy yield simulation: the model run that produces the P50.
- PVsyst report: the printed record of one simulation.
- Debt sizing and DSCR: how cash flow sets the loan size.
- Project finance model: the cash flow model lenders test.
Next step: if a lender asks for a bankable report, commission a specialist. Use the best solar simulation software list only to model your own P50 and P90, and the best solar financial modeling software list to test debt cover.
Sources
All sources checked October 2026.
- Checklists and independence. Solar Bankability D4.3 Technical Bankability Guidelines (15 February 2017). IEA PVPS Task 13 uncertainties page (modified 20 February 2026, report 2018).
- Assessor pages, undated, from a firm that sells these services. SgurrEnergy methodology. SgurrEnergy lenders advisory guide. Partner ESI (29 April 2020).
- Lender use, written by Solargis staff. PV Tech (23 March 2026). POWER (18 May 2026).
- Software. PVsyst help. SAM help. PVcase help. PVcase bankable page. Solargis knowledge base. Solargis Evaluate.
Last updated 30 October 2026. Next scheduled review: 30 January 2027.