Key takeaways
- A project finance model sizes debt from the project’s own cash flow, not from the sponsor’s balance sheet. Sculpted debt has repayments shaped to that cash flow.
- This example’s 5 MWdc project (DSCR 1.30, 6.0% interest, 15 years) supports 3,490,358 USD of sculpted debt, or 64.5% of capex plus reserve.
- Year 1 of our waterfall pays 330,769 USD of debt service and 2,288 USD into the reserve. It leaves 96,943 USD for equity.
- Debt service is fixed at sizing. A yield 12.5% lower in every year drops DSCR to this example’s 1.10 lock-up line, and 18.8% lower takes it to 1.00.
- The target DSCR is an assumption to show, not a fact to look up. Each 0.10 step from 1.20 to 1.50 cut debt by 216,070 to 290,863 USD.
To size debt from a target DSCR in software, see the best solar financial modelling software.
Project finance model at a glance
It answers one lender question: how much debt can this project’s cash flow carry, and what happens when the cash flow falls short?
| Item | Detail |
|---|---|
| Core test | DSCR = cash available for debt service (CFADS) ÷ debt service for the same period. Our example: 1.30 in every loan year. |
| Main outputs | Debt size, equity needed at close, DSCR by period, reserve balances, cash to equity, equity IRR. |
| Where it matters | Lender packs, developer and EPC bids, sale of a project company, PPA pricing, refinancing. |
| Standard or rule | No solar-specific standard found. Each lender sets its own ratios, reserves and tests. |
| In software | Of the three tools below, SAM sizes debt from a DSCR. The other two take a loan input. |
Why does a project finance model matter for installers and developers?
The model sets how much of the build cost a lender will fund. So it sets the equity cheque and the price you must win. A small change in capex or yield moves debt size, and a buyer will ask to see the working. Read financial modelling first for the general method.
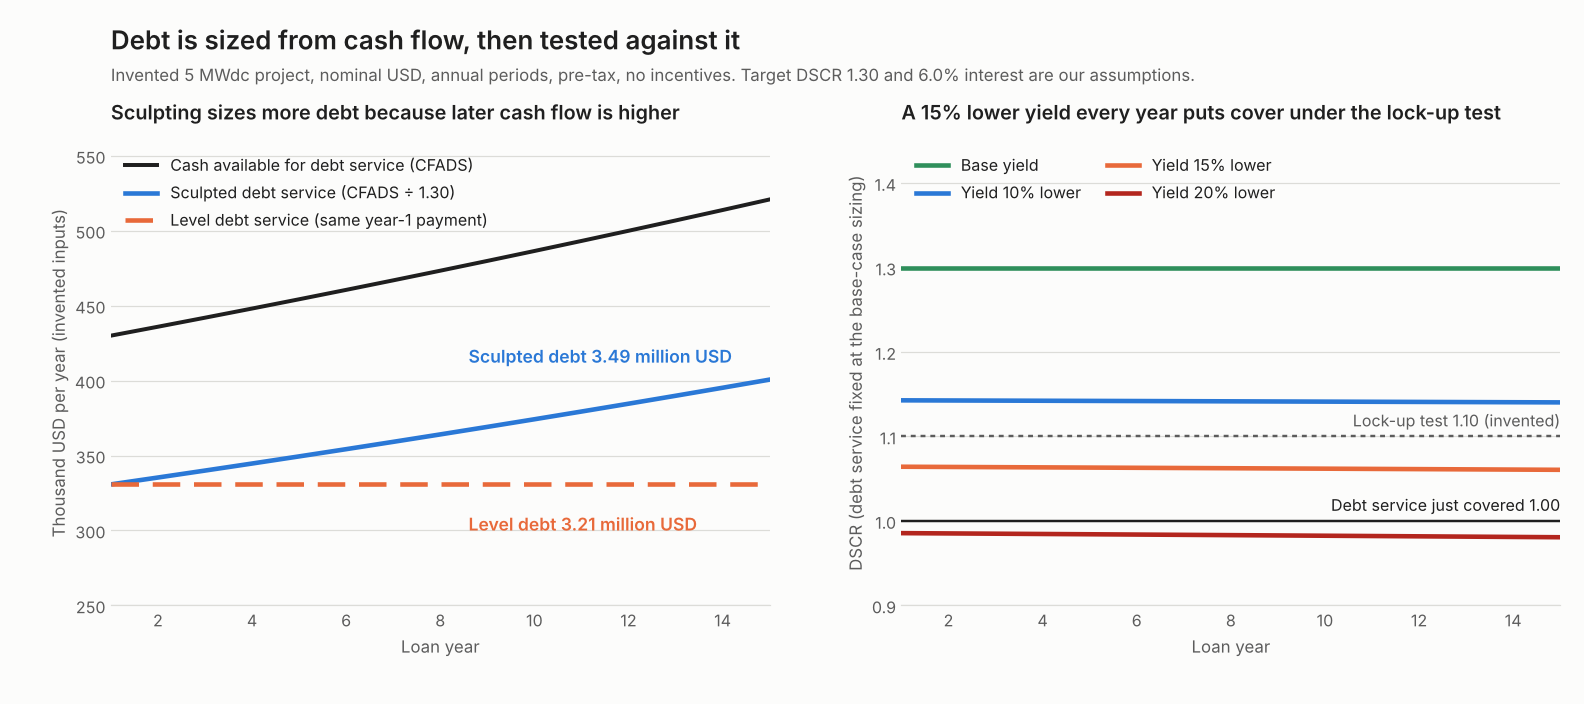
Figure 1. In our example case, sculpting sizes 277,845 USD more debt than level payments. A 15% lower yield in every year then puts cover below the lock-up line, which it first crosses at 12.5% (between the 10% and 15% rows of the stress table).
How does a project finance model differ from a normal financial model?
It models a separate company, and lenders look to that company’s cash flow for repayment. A normal model asks what the owner earns. This one asks whether the lenders get paid.
The World Bank’s PPP page says the private party is "a specific project company formed for that purpose", often called a special purpose vehicle (SPV). It also says that under non-recourse financing "lenders can be paid only from the project company’s revenues". Where recourse is limited, lenders look to the cash flows of the SPV’s assets. Lenders may also want extra credit support. So debt terms follow the cash flow, not the sponsor’s balance sheet.
That changes what the model must hold. A general solar model, as on the financial modelling page, reports IRR. A project finance model adds four things.
- Debt sizing. Debt is an output found from a target cover ratio. It is not an input.
- Reserve accounts. Cash held back to cover a bad period. Forvis Mazars says a debt service reserve account (DSRA) is "a cash reserve that works as an additional security measure for the lender".
- A waterfall. A fixed payment order. SJKP Law Firm says senior debt service is paid "next, followed by subordinated debt service, then distributions to equity holders".
- Covenant tests. Forvis Mazars says lock-up "is triggered when the DSCR falls below a specified level, set lower than the structuring-phase target".
For the cash table itself, see cash flow analysis. For the cost lines, see capex and opex.
How is debt sized to a target DSCR?
Sizing is one step of the model. This section gives the steps, and the debt sizing and DSCR page goes deeper on that step alone.
Pick a target DSCR and divide each period’s CFADS by it. That gives the most debt service the project can pay. Discount that stream at the loan rate. The sum is the debt.
The Renewables Valuation Institute (13 April 2023) says debt service "is determined by dividing the quarterly CFADS by the target DSCR". The source uses quarters and this page uses years. Forvis Mazars (24 September 2026) says debt sculpting "shapes each individual repayment to match the project’s cash flow profile across the loan life".
- Forecast CFADS for each period: revenue less operating costs (and tax, if modelled). See P50, P90 and P99 for the yield case.
- Choose the target DSCR and the loan tenor.
- Sculpted: debt service = CFADS ÷ target DSCR in each period. Level: one payment = the lowest CFADS ÷ target DSCR.
- Debt = the present value of the debt service at the loan interest rate.
- Split each payment into interest (on the opening balance) and principal. The balance must reach zero at the last payment.
- Test the result against a downside case, with debt service held fixed.
SAM’s help warns that if revenue is very high against costs, a DSCR-based size can be "unrealistically high". It advises checking the debt percent. The sizing table shows debt as a share of capex plus reserve for the same reason.
Worked example: a 5 MWdc ground-mount SPV
All inputs below are example for teaching. The model sizes debt and runs three years of the waterfall. It then stresses the yield.
| Input (all our assumptions) | Value |
|---|---|
| Size and capex | 5,000 kWdc at 1.05 USD per W = 5,250,000 USD at year 0 |
| Energy | 1,600 kWh per kWdc in year 1, falling 0.5% a year. 25 years |
| Price | 0.065 USD per kWh in year 1, rising 2% a year |
| O&M | 18 USD per kWdc in year 1 (90,000 USD), rising 2% a year |
| Debt | 15 years, 6.0% a year, annual payments, target DSCR 1.30 |
| Reserve (DSRA) | 6 months of next year’s debt service, funded at close, no interest earned |
| Lock-up test | Distributions stop below DSCR 1.10 (example) |
| Left out | Tax, depreciation, incentives, fees, construction interest, land, insurance and inverter replacement |
See degradation rate and O&M for those inputs. We assume revenue lasts all 25 years, for example under a power purchase agreement. Year-1 CFADS is 520,000 less 90,000, which is 430,000 USD.
| Sizing result | Sculpted | Level |
|---|---|---|
| Debt | 3,490,358 USD | 3,212,513 USD |
| Reserve funded at close | 165,385 USD | 165,385 USD |
| Equity at close | 1,925,027 USD | 2,202,871 USD |
| Debt as share of capex plus reserve | 64.5% | 59.3% |
| DSCR, lowest and average | 1.30 and 1.30 | 1.30 and 1.43 |
| Equity IRR (before tax) | 8.81% | 8.61% |
Project IRR before debt is 7.81% in both cases. Equity IRR is higher with debt here only because 6.0% interest is below 7.81%. The IRR page shows how debt can also lower it.
The first three years of the sculpted case run through the waterfall in this order: CFADS, interest, principal, reserve top-up, then equity.
| Line (USD) | Year 1 | Year 2 | Year 3 |
|---|---|---|---|
| CFADS (revenue less O&M) | 430,000 | 435,948 | 441,975 |
| Interest | 209,421 | 202,141 | 194,148 |
| Principal | 121,348 | 133,204 | 145,833 |
| Debt service (interest plus principal) | 330,769 | 335,345 | 339,981 |
| Reserve top-up | 2,288 | 2,318 | 2,349 |
| Cash to equity | 96,943 | 98,285 | 99,645 |
| DSCR | 1.30 | 1.30 | 1.30 |
The reserve grows each year because next year’s debt service is higher. It is released in year 15, when no debt service follows. All three years pass the lock-up test, so equity gets paid.
Now fix the debt service and cut the yield in every year. The reserve is not counted here, so a bad year would draw on it.
| Yield change | Lowest DSCR | Years below 1.10 (lock-up) | Years below 1.00 |
|---|---|---|---|
| Base | 1.30 | 0 of 15 | 0 of 15 |
| 5% lower | 1.22 | 0 of 15 | 0 of 15 |
| 10% lower | 1.14 | 0 of 15 | 0 of 15 |
| 15% lower | 1.06 | 15 of 15 | 0 of 15 |
| 20% lower | 0.98 | 15 of 15 | 15 of 15 |
The table steps are 5%, so it does not show the crossing points. Our model puts the lock-up line at a 12.5% lower yield and DSCR 1.00 at 18.8%. These are flat cuts in every year, not a P90 case. A lender would choose its own downside cases.
The inputs you choose move the debt. Each row below changes one input from the sculpted base. The first table covers the target DSCR and the interest rate.
| Input changed | Debt (USD) | Equity at close (USD) | Equity IRR |
|---|---|---|---|
| Target DSCR 1.20 | 3,781,221 | 1,647,945 | 8.98% |
| Target DSCR 1.40 | 3,241,047 | 2,162,525 | 8.69% |
| Target DSCR 1.50 | 3,024,977 | 2,368,356 | 8.59% |
| Interest 5.0% | 3,739,040 | 1,676,345 | 9.92% |
| Interest 7.0% | 3,265,598 | 2,149,786 | 7.96% |
The second table covers the loan tenor and the reserve.
| Input changed | Debt (USD) | Equity at close (USD) | Equity IRR |
|---|---|---|---|
| Tenor 12 years | 2,965,563 | 2,449,821 | 8.34% |
| Tenor 18 years | 3,949,396 | 1,465,989 | 9.63% |
| Reserve 0 months | 3,490,358 | 1,759,642 | 9.37% |
| Reserve 12 months | 3,490,358 | 2,090,411 | 8.33% |
A bigger reserve lowers equity IRR because equity funds it. A longer tenor raises debt only if revenue lasts that long. Compare equity IRRs only within this table. Each row changes the equity cheque.
Calculator: size debt to a target DSCR
Enter your own inputs. The defaults are the example above. The calculator reproduces every table on this page.
If the calculator does not load, open it in its own page.
How solar software handles a project finance model
Only SAM sizes debt from a DSCR, and it does so in three of its models. Solargis Prospect and HelioScope take a loan input and do not mention DSCR. Three tools are below, checked October 2026.
| Software | Sizes debt from DSCR? | Method |
|---|---|---|
| SAM | Yes | Modelled |
| Solargis Prospect | Not stated | Modelled |
| HelioScope | Not stated | Modelled |
- SAM: It sizes debt in its single owner, partnership flip and community solar models. Debt is set "as a fraction of net capital cost" or from a DSCR ("constant annual" DSCR). PySAM lists a DSRA input in months of P&I (default 6) and a default DSCR (see the FAQ on a good DSCR). The word "sculpt" is not used. Source: SAM help, Debt and Equity (undated). PySAM 4.2.0 docs (undated)
- Solargis Prospect: Inputs list a loan amount, interest rate and loan period. Results include project and equity IRR. DSCR and debt service are not mentioned. Source: Solargis knowledge base, updated 24 September 2026
- HelioScope: It offers loan financing with a down payment, term and annual percentage rate. DSCR, equity and reserve are not mentioned. Source: HelioScope financial glossary, updated 4 August 2026
Not stated means the company page we cite does not say. The RVI debt sizing page automates sculpting with a VBA macro in a spreadsheet. To compare tools that handle debt and returns, see the best solar financial modelling software.
Common mistakes with a project finance model
FAQs
What is the difference between a project finance model and a financial model?
A project finance model treats the project as a separate company and adds debt sizing, reserves, a payment waterfall and cover tests. A general solar financial model may report only IRR and NPV. See financial modelling.
What is a good DSCR?
No single figure applies, because each lender sets its own. As labelled examples only, SAM’s PySAM docs print a default of 1.5, and this page’s example uses 1.30. No solar-specific standard is cited, so check the term sheet.
What is sculpted debt?
Sculpted debt has repayments shaped to the cash flow, so cover stays near the target each year. In our example, it equals the target in all 15 years. A level loan has one payment. Its cover starts at 1.30 and rises to 1.57 in year 15.
How big is a debt service reserve?
Forvis Mazars (page from 2015) says it is generally sized to a number of months of projected debt service, "commonly six or twelve". A more recent source agrees the range still holds: the Renewables Valuation Institute (dated 1 March 2023) puts a DSRA at "6-18 months of debt service payments". Check current lender terms. We used six months.
What happens at lock-up?
Cash that would go to equity is held back while cover is below the test. In our example case the test is DSCR 1.10. It trips at a 12.5% lower yield every year.
Related terms
- Debt sizing and DSCR: how much debt a project cash flow can repay.
- NPV: the value today of future cash flows.
- IRR: the return rate that makes those cash flows net to zero.
- Feasibility study: the go or no-go stage before a model like this.
- Third-party ownership: how an outside owner holds the system and sells its output, which changes who needs the model.
- Bankable energy yield: the yield case behind lender sizing.
Next step: to find a tool that sizes debt and tests cover on your own project, see the best solar financial modelling software.
Sources
- World Bank PPP Resource Center: finance structures in PPP, no date printed, copyright 2026 (checked October 2026).
- Renewables Valuation Institute: debt sizing with target DSCR, 13 April 2023 (checked October 2026).
- Renewables Valuation Institute: solar project finance modeling, 28 February 2023 (checked October 2026).
- Forvis Mazars: debt service coverage ratio, 24 September 2026 (checked October 2026).
- Forvis Mazars: debt service reserve account, 25 June 2015 (checked 30 October 2026).
- Renewables Valuation Institute: DSRA debt service reserve account, 1 March 2023 (checked 3 November 2026).
- SJKP Law Firm: infrastructure finance structures, 21 May 2026, hosted on the firm’s daeryunlaw.com site (checked 30 October 2026).
- SAM help: Debt and Equity, undated, and PySAM 4.2.0 Singleowner documentation, undated (checked October 2026).
- Solargis knowledge base: financial analysis, updated 24 September 2026 (checked October 2026).
- HelioScope: Financial Modeling Glossary, updated 4 August 2026 (checked October 2026).
Last updated 3 November 2026. Next scheduled review: 30 January 2027.