Key takeaways
- Our 1 MWdc example costs 1,120,000 USD upfront. Running it costs 21,500 USD a year, plus 50,000 USD for inverters in year 12.
- Capex is 61.7% of lifetime cash cost. It is 77.7% of discounted cost at a 6% real rate, before tax.
- Paying the same 50,000 USD at year 0, not year 12, raised LCOE by 1.7% and left payback at 13.5 years. Cash spent stayed 1,815,000 USD in every case. Only timing moved.
- Paying a 30-year land lease at year 0 raised LCOE by 7.9%. Payback rose from 13.5 to 14.8 years.
- NREL’s 2025Q1 benchmark splits installed cost into eight categories. It gives O&M separately, per kWdc per year (2024 USD, modelled benchmarks, not surveyed prices).
To model capex, opex and LCOE in software, see the best solar financial modelling software.
CAPEX and OPEX at a glance
You pay capex before the plant earns. You pay opex while it runs. Models treat them as year-0 and year 1-to-N cash flows.
| Item | Detail |
|---|---|
| Formula | Capex per watt = total installed cost ÷ watts dc. Opex per kWdc-yr = yearly running cost ÷ kWdc. |
| Unit | USD per Wdc (capex). USD per kWdc per year (opex). |
| Where it matters | LCOE, IRR, NPV, payback, PPA pricing, tax planning, lender models. |
| Standard or rule | No solar-specific standard. Accounting and tax rules decide each line. |
| In software | Cost inputs in design, simulation and finance tools. Categories differ by tool. |
What counts as capex and what counts as opex?
Capex is whatever you need to reach commercial operation. Opex is the cost of keeping the plant running afterwards. Some lines sit on the border. Tools treat them differently.
- Usually capex: modules, inverters, racking. Also electrical balance of system, installation labour and interconnection. Permitting, developer and EPC overhead and contingency count too. NREL’s ATB says capex is "expenditures required to achieve commercial operation". It says capex includes the inverter.
- Usually opex: O&M contract, cleaning, monitoring. Also asset management, insurance, land lease and vegetation control. The ATB’s fixed O&M list names asset management, insurance products, site security, cleaning, vegetation removal and component failure.
- Border lines: inverter replacement, land and insurance. SAM puts land costs in installed (capex) cost. It models battery replacement as an operating cost. PVsyst lists insurance and land under installation costs. It also lists insurance under grid-connected operating costs. Its replacement costs are scheduled by year.
So check each tool’s own categories. A bill of materials gives the hardware quantities behind the capex lines. See bill of materials. The O&M page covers recurring costs.
How does NREL structure its cost benchmark?
NREL splits installed cost into eight categories. It benchmarks O&M separately. The latest set is 2025Q1, in 2024 USD. It leaves out owner subsidies and tax credits. Its data.gov entry names the National Laboratory of the Rockies as publisher.
The US Department of Energy’s benchmark page names the eight categories:
- Hardware (five): module, inverter, energy storage system, structural balance of system and electrical balance of system.
- Soft costs (three): fieldwork (installer work on site), office work (installer work off site) and other (developer costs not included elsewhere).
Installed cost per watt falls as system size rises.
| PV-only system, 2025Q1 | Size | Installed cost, minimum sustainable / modelled market price (USD per Wdc) | O&M (USD per kWdc-yr) |
|---|---|---|---|
| Residential | 8 kWdc | 2.78 / 2.95 | 34 |
| Commercial | 250 kWdc | 1.95 / 1.98 | 40 |
| Utility-scale | 100 MWdc | 1.07 / 1.12 | 20 |
These are modelled benchmarks, not a survey of project prices. The page defines the minimum sustainable price (MSP) as the lowest price a company can charge, with inflation adjustment. It defines the modelled market price (MMP) as the actual market price. That may differ because of temporary distortions.
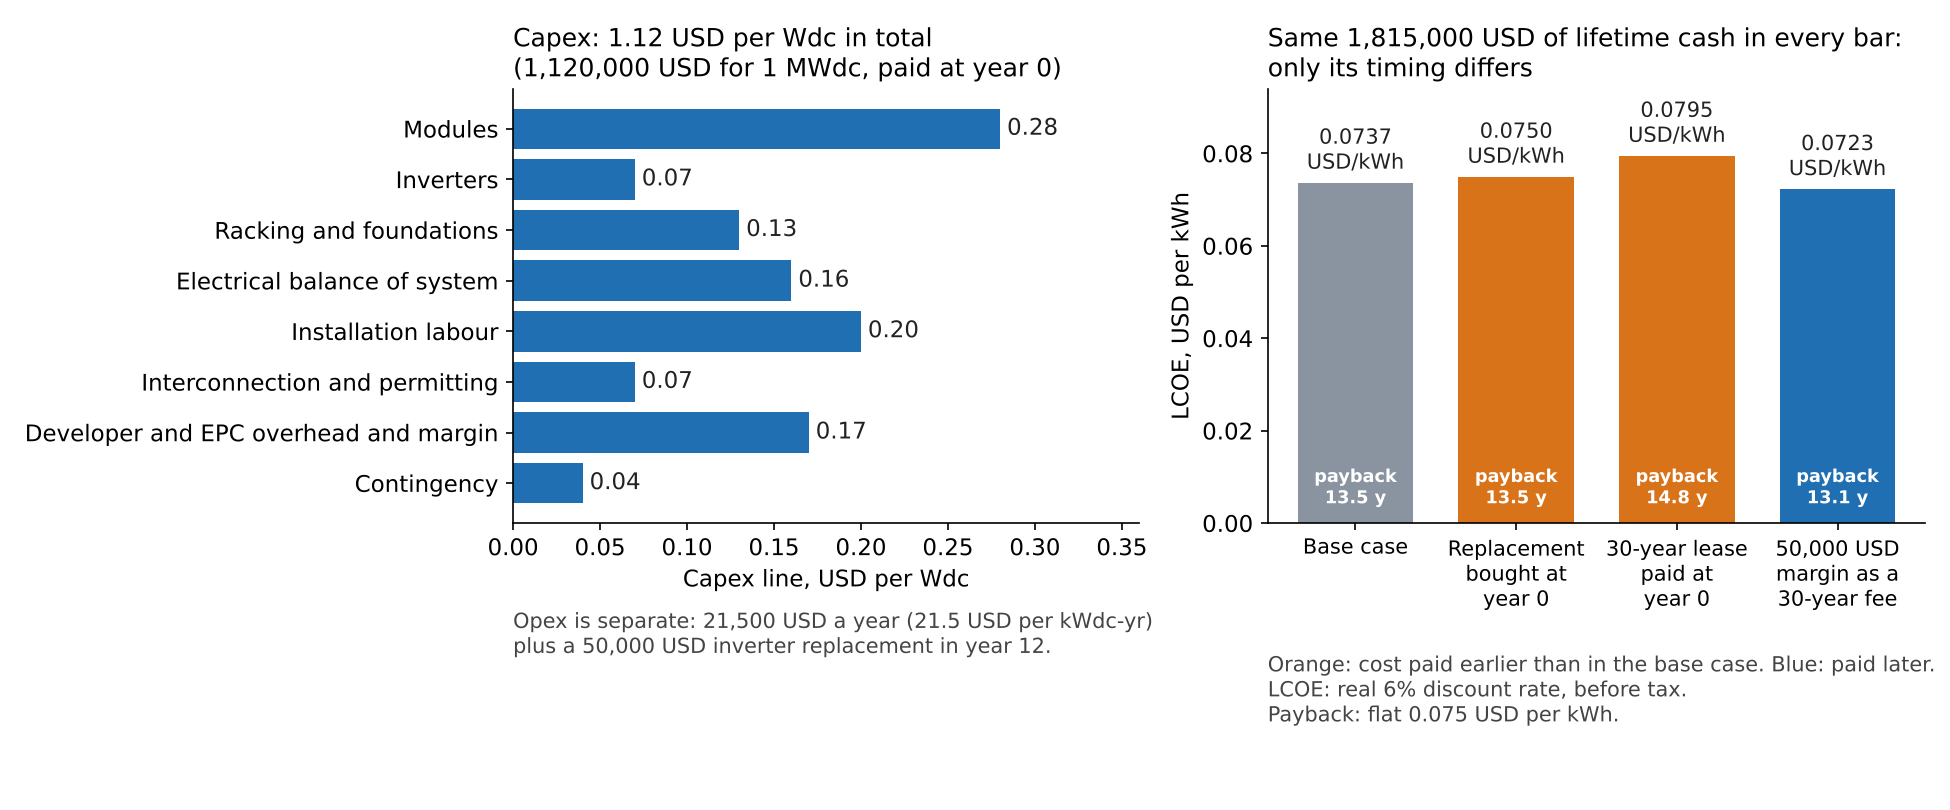
Figure 1. Moving the same cash earlier raised LCOE by 1.7% to 7.9% in our example, and moving it later cut LCOE by 1.9%.
Why does the capex and opex split matter?
The split matters because you pay capex first and opex later. Money paid first costs more once discounted. Labels alone change nothing in a cash-flow model.
- LCOE. Models discount costs and energy. So capex counts in full, and opex counts at present value. The LCOE page has the method and benchmarks.
- IRR and NPV. Capex is the year-0 outflow. Opex and replacements cut later inflows. See IRR and NPV.
- Payback. Here payback is the year when cumulative net cash repays the year-0 spend. It counts degradation and the year-12 replacement. A cost after payback does not move it. See payback period.
- PPA. A power purchase agreement moves capex to the third-party owner. The host pays per kWh. Some offers call this the "OPEX model". The PPA price must cover both capex recovery and opex.
- Tax. IRS Publication 946 (2025) says depreciation is an annual deduction that recovers the cost of property. The property must have a useful life that extends substantially beyond the year placed in service. Land cannot be depreciated. Ask your tax adviser how each line is treated.
How do you calculate capex per watt and opex?
- List every upfront line in USD per Wdc and add them. That is capex per watt. Multiply by watts for total capex.
- List yearly running costs in USD and add them. Divide by kWdc for USD per kWdc-yr.
- Add one-off later costs, such as an inverter replacement, and note the year.
- Work out energy by year from the year-1 yield and the degradation rate.
- Discount costs and energy at one real rate. LCOE is discounted cost divided by discounted energy.
Worked example: a 1 MWdc ground-mount project
The base case has capex of 1.12 USD per Wdc and opex of 21,500 USD a year for 1 MWdc. The 1.12 is our assumption for 1 MWdc, not a benchmark. NREL’s 1.12 is for a 100 MWdc plant, so the two are not comparable.
We follow the LCOE page’s convention. Capex falls at year 0, and opex and energy fall at year ends. The rate is a real 6%, before tax, with no incentives or debt. The model reproduces that page’s base case to twelve decimals, then runs this project. It also matches an annuity formula.
| Input | Value |
|---|---|
| Hardware capex (USD per Wdc) | Modules 0.28. Inverters 0.07. Racking and foundations 0.13. Electrical balance of system 0.16 |
| Other capex (USD per Wdc) | Installation labour 0.20. Interconnection and permitting 0.07. Developer and EPC overhead and margin 0.17. Contingency 0.04 |
| Total capex | 1.12 USD per Wdc = 1,120,000 USD |
| Opex (USD per year) | O&M contract and cleaning 8,500. Monitoring and asset management 2,500. Insurance 3,500. Land lease 7,000. Total 21,500 = 21.5 USD per kWdc-yr |
| Replacement | Inverters, 50,000 USD (0.05 USD per Wdc) in year 12 |
| Energy | 1,480 kWh per kWdc in year 1. 0.4% degradation a year. 30 years |
| Rate and value | 6% real discount rate. Payback uses a flat 0.075 USD per kWh |
Base LCOE is 0.0737 USD per kWh. Capex adds 0.0573. Opex with replacement adds 0.0164. Simple payback is 13.5 years. Each move below keeps lifetime cash at 1,815,000 USD.
| Case | Capex and year-1 opex (USD) | LCOE (USD per kWh) | Change in LCOE | Simple payback (years) |
|---|---|---|---|---|
| Base | 1,120,000 and 21,500 | 0.0737 | 0 | 13.5 |
| Replacement bought at year 0 | 1,170,000 and 21,500 | 0.0750 | +1.7% | 13.5 |
| 30-year land lease paid at year 0 | 1,330,000 and 14,500 | 0.0795 | +7.9% | 14.8 |
| 50,000 USD of margin paid as a 30-year fee | 1,070,000 and 23,167 | 0.0723 | -1.9% | 13.1 |
A pure relabel changes nothing. Booking the year-12 replacement as capex, but still paying it in year 12, leaves LCOE at 0.0737 and payback at 13.5 years. Timing does change the result. The year-0 replacement leaves payback at 13.5 years. It falls before payback anyway. Say the replacement fell in year 16, after payback. Payback would be 12.9 years, against 13.5 if paid at year 0. LCOE would be 0.0734 against 0.0750. A higher discount rate widens the gap. The prepaid lease raises LCOE by 4.6% at 3% and 10.2% at 9%.
Capex and opex calculator
Change any line, move the replacement year, or prepay the lease. The calculator is a design aid, not advice.
How solar software handles capex and opex
SAM, PVsyst and Aurora separate year-0 and yearly costs. HelioScope and RatedPower do so only in part. Replacements differ: SAM treats battery replacement as an operating cost, and PVsyst schedules replacements from component lifetime.
| Software | Separates upfront and yearly costs? | Company page (checked October 2026) |
|---|---|---|
| SAM | Yes | SAM help pages on installation costs and operating costs. Undated |
| PVsyst | Yes | PVsyst help, installation and operating costs. No date shown |
| Aurora Solar | Yes, commercial projects. The words capex and opex are not used | Aurora help, Financial analysis overview, updated 15 May 2026 |
| HelioScope | Partly | HelioScope financial modelling glossary, updated 4 August 2026 |
| RatedPower | Partly | RatedPower CAPEX glossary (13 March 2024), OPEX glossary (25 March 2025), LCOE blog (19 September 2022) |
Partly: the company page covers some cost lines without a full upfront and yearly split.
How and where each tool handles it:
- SAM: installation costs are year-0 direct and indirect capital costs plus sales tax. Operating costs recur from year 1. Battery replacement is an operating cost.
- PVsyst: installation costs and OPEX, with payments yearly, over a range or in set years. Replacements are scheduled from component lifetime.
- Aurora Solar: system cost is set on the Pricing page. Fixed and variable O&M run annually. Inverter replacement is an account default under Settings, Financing. Its page does not use the words capex or opex, but it sets cost and O&M separately.
- HelioScope: lists an annual maintenance cost in dollars per watt. The glossary does not define capex, opex or replacements.
- RatedPower: company glossary pages define capex and opex in general terms. None of the three pages says what cost lines the tool outputs.
For finance tools that model capex, opex and replacements, see the best solar financial modelling software. For large sites, see the utility-scale design software list.
Common mistakes with capex and opex
CAPEX model or OPEX model: which should the customer pick?
This is a general framing, not advice. The choice depends on cash, tax position, risk and contract terms. A project’s own numbers must settle it.
- Buy outright: the customer pays the full capex at year 0 and then carries the opex. See solar loan for borrowing the capex.
- PPA: a third party owns the plant. The customer pays per kWh, so no capex falls on the customer. See power purchase agreement and third-party ownership.
- Lease or subscription: the customer pays a fixed regular fee for the plant or its output. See solar lease. Terms vary by contract.
FAQs
Is inverter replacement capex or opex?
In our example the 50,000 USD is paid in year 12 as a one-off, and calling it capex or opex leaves LCOE at 0.0737 USD per kWh. Tools differ: SAM models battery replacement as an operating cost, NREL’s ATB lists component failure under fixed O&M, and PVsyst schedules replacements by year. Your accountant decides how to book it.
What capex per watt does NREL publish?
For PV-only systems in 2025Q1, the modelled market price is 1.12 USD per Wdc at 100 MWdc. It is 1.98 at 250 kWdc and 2.95 at 8 kWdc, in 2024 USD. Real quotes vary with scope, site and date.
Does the capex and opex split change LCOE?
Only through timing. Relabelling a cost paid in the same year changes nothing. Paying it earlier raises LCOE. Paying it later lowers it, as the example shows.
What does the OPEX model mean in solar?
It usually means a third party owns the plant. The customer pays per kWh under a PPA, so no capex sits with the customer. The owner still carries the plant’s own capex and opex.
Related terms
- LCOE: discounted lifetime cost divided by discounted energy.
- Payback period: years for cash to repay the spend.
- O&M: the monitoring and repair work behind most opex.
- Balance of system: everything in a plant except the modules.
Next step: model your own upfront cost, yearly cost and replacements in a tool from the best solar financial modelling software.
Sources
NREL (the National Renewable Energy Laboratory) was renamed the National Laboratory of the Rockies (NLR) in December 2025. Its nrel.gov pages retired in May 2026. This page links to the current nlr.gov addresses and keeps the name NREL for documents published under it.
- Benchmarks. US DOE, Solar Photovoltaic System Cost Benchmarks (2025Q1, page metadata modified 2 September 2026). NLR data catalogue entry (submitted 27 October 2025, last updated 12 March 2026). NREL Q1 2023 report (September 2023). NREL ATB 2025, commercial PV.
- Tax. IRS Publication 946 (2025). Only the depreciation basics are cited.
- Software. SAM installation costs. SAM operating costs. PVsyst costs. Aurora. HelioScope. RatedPower: CAPEX, OPEX, LCOE.
Last updated 30 October 2026. Next scheduled review: 30 January 2027.