Key takeaways
- A map is a screen, not an approval. The New York Joint Utilities FAQ calls its maps "not an interconnection approval". FirstEnergy says values "may change at any time".
- Values do not compare across utilities. In New York, the PV value is the smallest export level where any one of six checks fails. The National Grid guide and FirstEnergy page do not say which limits they use.
- Find your map in DOE’s atlas. As of May 2024 it counted 58 utilities and state agencies with published maps, covering 26 states.
- Maps treat the queue in different ways. The Joint Utilities PV map typically leaves out queued DER. National Grid has a layer that counts pending generation.
- In our example, a 900 kW map value leaves -100 kW of margin if the map ignores a 600 kW queue. It leaves +500 kW if the map counts it.
To layer utility hosting capacity maps onto a site search, see the best solar site selection software.
Hosting capacity map at a glance
It is a web map. It colours feeders or line sections by the estimated room for new generation. Names vary by state.
| Item | Detail |
|---|---|
| Other names | Integration capacity analysis (ICA) map in California. "Solar Accommodation Map, commonly referred to as a Hosting Capacity Map" at FirstEnergy in Ohio. |
| Unit | MW on the Joint Utilities and National Grid maps. Other maps give their own units, so read each map’s notes. |
| Where it matters | Site screening and pre-application planning, before you size a system or file. |
| Standard or rule | No single national standard is cited here. IREC lists a 2021 report on key decisions and a 2022 report on data validation. State regulators such as the CPUC set map rules. |
| In software | Some siting tools load utility maps as layers. The utility’s portal is still the source. |
Why hosting capacity maps matter for installers and developers
A map shows early if a site may need grid work. That saves time on sites the grid cannot take.
SDG&E says its website is "intended to provide an initial screening of generation interconnection projects". For the form and fees that come next, see the interconnection application page.
What does a hosting capacity map show?
It estimates how much generation a feeder or line section could take before a modelled limit is reached. The Joint Utilities define the PV value as "The smallest PV export level (MW) at which any single constraint is violated."
- Six PV checks (Joint Utilities FAQ): thermal loading, primary over-voltage, voltage deviation, regulator deviation, flicker, and anti-islanding or backfeed protection.
- Storage: the Joint Utilities show battery charging and discharging as two layers. Con Edison lists storage and EV load capacity.
- A range: Con Edison’s maximum value is typically at the upstream end of a line section. Its minimum is typically at the downstream end.
- Other generation: National Grid’s pop-ups list connected and pending DG. The Joint Utilities maps have connected and queued fields.
- Thermal-only maps: the Joint Utilities electrification map is "strictly a thermal capacity margin, not a voltage or protection analysis".
What does a hosting capacity map not show?
It does not show approval, cost or site limits. Utilities state these limits on their own pages.
- Approval: the Joint Utilities FAQ says "None of the maps represent a final interconnection determination."
- Cost: SDG&E says the customer "should not rely on any cost estimates on this website".
- Permitting: the Joint Utilities use-case guidance (a draft) says a "good" map result is not a permitability determination.
- Some lines: Con Edison says "We do not currently display network feeder locations." SDG&E says feeder branch routes have no data.
- Queued capacity: on the PV map, the Joint Utilities FAQ says "Queued (not yet built) DER are typically excluded." FirstEnergy’s map skips them too.
- Planned upgrades: on the electrification map, the Joint Utilities FAQ says "Planned upgrades are generally not embedded unless already in service."
- Change over time: NREL calls an analysis "a snapshot of a distribution grid’s current ability" to connect new DERs.
What do utility hosting capacity maps say about themselves?
Each utility describes its map and limits in its own way. The table shows what each page says, with any date it prints.
| Utility and map | What the page says it shows | Its own limit | Source page |
|---|---|---|---|
| Con Edison (New York), hosting capacity platform | Maximum and minimum hosting capacity, storage and EV load capacity. Maximum is the value "without incurring system upgrade costs". | "not a replacement for the Coordinated Electric System Interconnection Review (CESIR) process". | About and FAQ pages, undated. |
| National Grid (Massachusetts), System Data Portal | The "current available Solar MW capacity of distribution lines". One layer counts pending generation, one installed only. | "not a guarantee that generators can interconnect at any particular time and place". | User guide, November 2020. Monthly updates. |
| FirstEnergy (Ohio Edison, Toledo Edison, Illuminating Company) | One estimated value per transformer dot on distribution circuits. | "to be used as guidance only". Capacity shown "does not guarantee approval of an interconnection without system upgrades". | Accurate "as of January 2025", says the page. |
| SDG&E (California), ICA map | Substation details, including existing and queued generation. Feeder and line-section data when zoomed in. | "initial screening". "The interactive website map is not intended for construction." | ICA page, undated. Alert notice effective 9 July 2025. |
| Joint Utilities of New York (the utilities on its hosting capacity page) | PV and battery hosting capacity maps, plus an electrification map of thermal headroom. | "not an interconnection approval" and "do not replace utility engineering review". | Centralized FAQ, undated. PV and battery values refresh on a cycle that includes April. |
- Con Edison refresh cycle: the FAQ says PV and storage refresh every April. DG projects over 500 kW refresh every October. Queued and connected data refresh monthly.
Dates and map types differ. In California, the CPUC says ICA maps help contractors and developers find sites with grid capacity. It links portals for PG&E, SCE and SDG&E. It records a vote on D.24-10-030 on 23 October 2024. DOE lists maps by state. It does not maintain them and tells users to read each map’s instructions.
How do you read a hosting capacity map before a pre-application?
On any map, check four things: units, date, queued generation and line-section range. Six steps follow.
- Find your utility’s map. DOE’s atlas links maps by state. Some need an account.
- Read the map’s notes. Look for units, date, what the value means and what it leaves out.
- Find the feeder or line section at your connection point. Do not read a substation symbol as a feeder value.
- Note if the map gives one value or a range along the section.
- Check if the map counts queued or pending generation. If it does not, subtract it yourself.
- Compare your proposed AC size with the headroom. Then ask the utility. FirstEnergy notes that the capacity shown does not guarantee approval without upgrades.
How is a hosting capacity map different from the interconnection queue?
A map estimates grid room now. A queue lists who is waiting for it. On distribution maps, the queue often shows up only as a field or a layer.
Our interconnection queue page covers transmission-level queues in Berkeley Lab’s data. Those leave out the local distribution grid. After approval, the PTO step lets you switch on. For the devices a map counts, see DER. For software that manages limits after connection, see DERMS.
Worked example: reading headroom against a proposed system
All numbers below are example. They come from no utility map. The rule is ours. Net headroom is the map value minus any queued kW the map does not count. Margin is net headroom minus the proposed AC size.
| Case | Map value (kW AC) | Queued kW (counted in map value?) | Proposed (kW AC) | Margin (kW) |
|---|---|---|---|---|
| A | 1,200 | 300 (counted) | 400 | +800 |
| B | 900 | 600 (not counted) | 400 | -100 |
| C | 0 | none | 100 | -100 |
| D | 250 to 1,500 (two ends of one line section) | none | 400 | -150 to +1,100 |
In case A the map already counts the 300 kW queue, so nothing is subtracted. Case A fits, and case B is over. Case C shows no headroom at all, and case D depends on the connection point.
Case B shows why the queue matters. Its net headroom is 300 kW (900 minus the 600 kW queue). The 400 kW system misses by 100 kW. If its map had counted the queue, the same 900 kW value would leave +500 kW.
Case D shows why a range matters. The 400 kW system fits at the upper end but misses at the lower end. A pass here is not an approval.
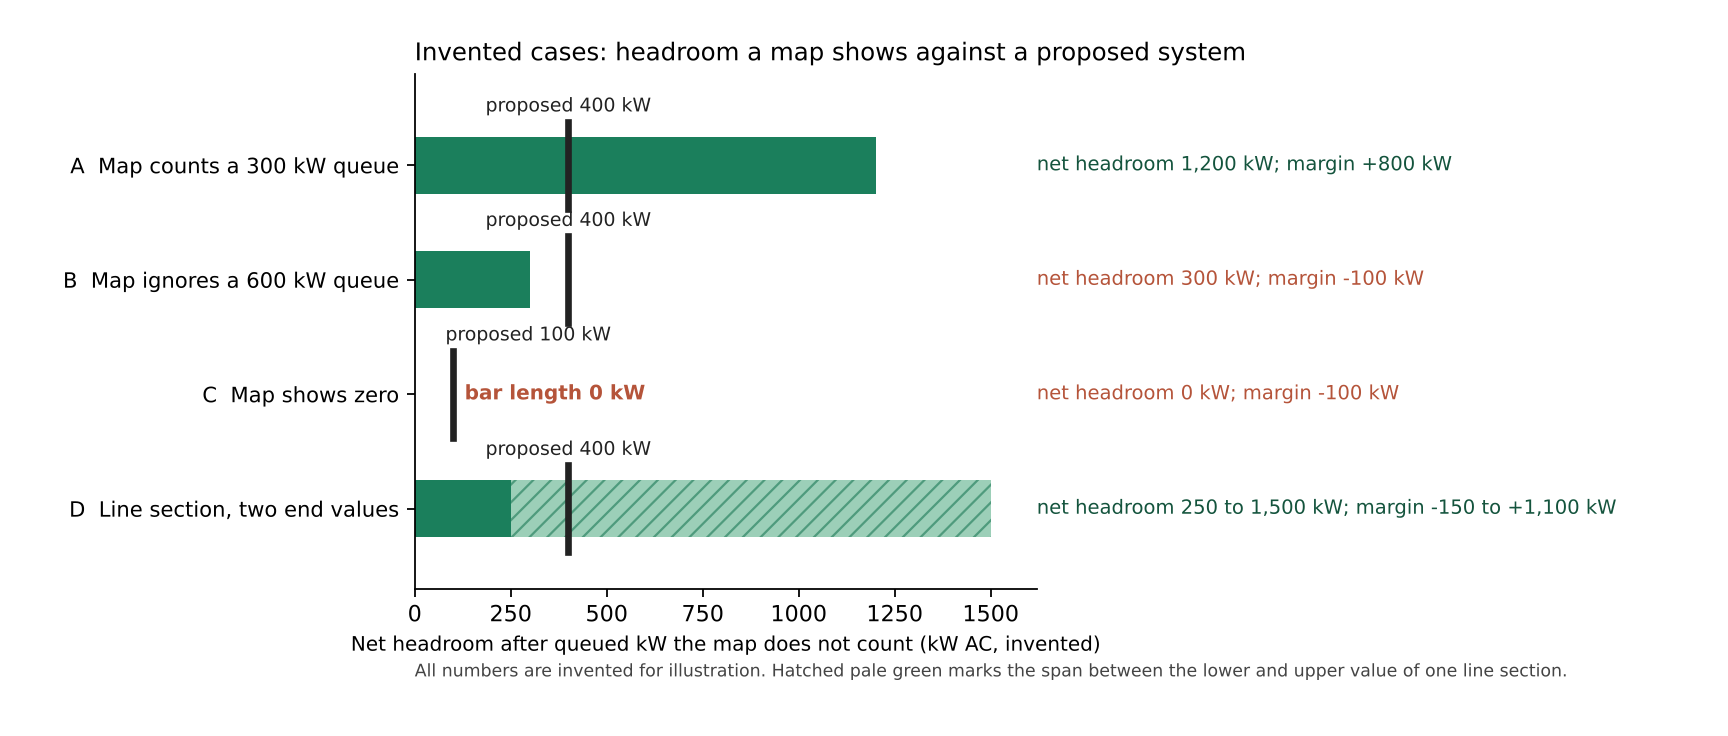
Figure 1. In four example cases, the same 400 kW proposal fits case A, misses case B by 100 kW, and fits case D only toward the upper end of the line section.
Hosting capacity headroom calculator
Run the headroom calculator below. It takes a map value, any queued kW the map does not count, and your proposed size. The defaults are case B.
How solar software handles hosting capacity maps
We read three company pages: two for PVcase Prospect and one for Glint Solar. Only one PVcase article documents loading utility hosting capacity maps as layers, and Glint Solar’s page does not mention them. "Yes" means the company page says it. "Not stated" means the company page we cite does not say it. Partly means it describes a related layer.
| Tool | Loads utility hosting capacity maps? | Source page (October 2026) |
|---|---|---|
| PVcase Prospect, hosting capacity maps | Yes | Help article "Hosting capacity maps for siting", undated. |
| PVcase Prospect, Capacity layer | Partly | Help article "Capacity", updated 21 September 2026. |
| Glint Solar | Not stated | Platform page, undated. |
- PVcase Prospect, hosting capacity maps: Explains how to add utility maps as line, polyline and polygon layers. Says "Always check for map-specific details like zoom restrictions and update frequency."
- PVcase Prospect, Capacity layer: Finds points of interconnection using grid and injection capacity, N-1 injection studies by bus and allocated costs. US sites only, and you need a subscription. It does not use the words hosting capacity or describe utility feeder maps.
- Glint Solar: Names substation distance and grid connections drawn on the map. It does not mention hosting capacity.
For more tools that screen sites, see the best solar site selection software and the best solar software for utility-scale developers. For how layers work, see site selection software and GIS.
Common mistakes with hosting capacity maps
FAQs
Is a hosting capacity map the same as an interconnection approval?
No. The Joint Utilities call their maps "not an interconnection approval". Con Edison says its value does not replace the CESIR process. FirstEnergy says a developer must still send a full application.
What does zero hosting capacity mean?
It means the map shows no room at that point. That does not close the door. FirstEnergy still takes applications on circuits shown with no capacity left. It says larger ones there will need significant upgrades paid for by the applicant.
How often are the maps updated?
National Grid’s Massachusetts guide says monthly. The Joint Utilities FAQ describes a cycle that includes April, with mid-cycle updates for busy circuits. FirstEnergy gives no schedule, so check the date on your map.
Where can I find my utility’s map?
Start with DOE’s atlas. As of May 2024, 58 utilities and state agencies had published maps, covering 26 states, Washington, D.C., and Puerto Rico. DOE’s utility table is labelled "Updated: July 2025", so it may list newer maps. State regulator pages, such as the CPUC’s, also link to utility portals. DOE says it does not maintain the maps.
Do the maps cover batteries?
Some do. The Joint Utilities show charging and discharging as two layers, because the limits differ. Con Edison lists storage capacity. Read the layer that fits your use.
Related terms
- Interconnection application: the form that asks a utility to approve a connection.
- Interconnection queue: the waiting list for grid studies.
- DER: a small generator, battery or load on the local grid.
- DERMS: software that controls groups of DER within grid limits.
- Distributed generation: generation at or near the customer, on the local grid.
Next step: open your utility’s map and note its units, date and queue treatment. Then compare siting tools in the best solar site selection software list.
Sources
All pages were checked in October 2026. Dates are as each page prints them.
- DOE atlas of hosting capacity maps (27 December 2023, modified 26 January 2026, count as of May 2024).
- IREC overview page (undated, lists the key decisions report as 16 September 2021 and the webinar as 6 October 2021).
- NREL, Data Validation for Hosting Capacity Analyses, NREL/TP-6A40-81811 (2022, the original web landing page for this report no longer resolves since the lab’s 2025 rename to the National Laboratory of the Rockies, checked November 2026).
- Joint Utilities of New York: FAQ, use-case guidance (draft) and map page (all undated).
- Con Edison: platform page and FAQ (both undated).
- National Grid Massachusetts portal guide (November 2020).
- FirstEnergy Ohio map page (accurate as of January 2025, per the page).
- SDG&E ICA page (undated, alert effective 9 July 2025).
- CPUC data portals page (undated, latest event 7 March 2025).
- PVcase help: maps for siting (undated) and Capacity (updated 21 September 2026). Glint Solar platform page (undated).
Last updated 30 October 2026. Next scheduled review: 30 January 2027.