Key takeaways
- Three published schemes use three severity bands. A 12 K difference is Medium or Moderate in two. It is Serious in Sitemark’s hot spot bands (5 and 15 K).
- IEA PVPS Task 13 (2018) says the IEC technical specifications carry no pass or fail criteria. No clause from IEC TS 62446-3 is quoted here.
- Ask any company for precision and recall by class, not one accuracy figure. One study’s ResNet50 scored 0.61 on 11 classes and 0.86 on 5.
- In an invented example, a classifier flags 427 findings. 349 are right, so precision is 81.7% and 78 flags are false.
- Rare faults mean more false flags. At 2% prevalence, with example 90% sensitivity and 98% specificity, only 47.9% of flags are real.
To see which inspection tools classify findings for you, read the best solar thermal inspection software.
Anomaly classification at a glance
| Item | Detail |
|---|---|
| What is classified | A finding from a thermal or visual image: its type, its extent (cell, substring, module, string) and its severity. |
| Severity inputs | Temperature difference over a reference, plus the type. Raptor Maps gives each type a default priority. Sitemark also gives a remedial action. |
| Standard | IEC TS 62446-3 (edition 1.0, 2017-06-15, per the IEC webstore) defines outdoor infrared inspection of PV plants. This page quotes no clauses. See what it says. |
Why does anomaly classification matter for installers?
It turns an image into a job list. "String offline, critical" starts a repair. "Soiling, low" starts a wash.
A wrong label costs a visit. A false flag sends a crew to a healthy module. A missed fault stays in the field. Labels feed O&M planning, work orders and the CMMS. The thermal inspection and drone inspection pages cover the imaging.
What are the main anomaly classes?
Companies and papers name a few core classes. They are hot spot, bypass diode, string or module offline, soiling, shading and junction box. Each has a look-alike that causes false flags.
| Class | Look-alike the sources name | Confirm with (our suggestion) |
|---|---|---|
| Hot spot | Soiling or shading that causes severe mismatch (Tsanakas and Marechal, 2025). Reflections (IEA PVPS Task 13). | Visible image, clean and re-image, then I-V curve tracing. |
| Bypass diode | A single diode and several diodes look alike and are hard to tell apart (EPJ-PV 2025). | I-V curve. |
| String or module offline | A combiner box or inverter fault gives the same look across every string on that device (Sitemark). | String current and voltage reading. |
| Soiling | A hot spot, when dirt causes severe mismatch (Tsanakas and Marechal, 2025). | Visible image. |
| Shading or vegetation | Local shading from bird droppings, small crops or small trees (IEA PVPS Task 13). | Visible image. |
| PID | Multi-hotspot or shading and soiling patterns (Tsanakas and Marechal, 2025). | Electroluminescence or I-V. See electroluminescence testing. |
| Junction box | None named in the sources read. | Inspect the connection after isolating the circuit. |
- Hot spot pattern: a single small, intense heat point (EPJ-PV 2025 Table 1). Raptor Maps: an anomalous spot on a cell. See hotspot.
- Bypass diode: one row or column warmer than the rest (EPJ-PV 2025). Raptor Maps: an activated diode, typically a third of the module. See bypass diode failure.
- String or module offline: even temperature across a whole module with no hot spots (EPJ-PV 2025). Sitemark: one group of modules a few degrees warmer than a comparable group, with a uniform temperature across it.
- Soiling: uniform cooling in affected areas, usually along the borders (EPJ-PV 2025). See soiling.
- Shading or vegetation: irregular warm and cool areas with gradual edges (EPJ-PV 2025). Sitemark says an Obstruction is "not an anomaly but just a warning".
- PID: Sitemark: hot spots starting at the module edges, beginning at the negative pole of the string.
- Junction box: Sitemark: junction boxes slightly warm up normally, but "a high temperature may indicate issues in the connections". Raptor Maps lists a Junction Box anomaly.
How does software decide a class and a severity?
The company pages describe parts of the same five steps. The order here is an editorial summary.
- Find each module in the image and place it on the site layout.
- Read the pattern and how far it spreads. It may be a cell, a third of a module, a module, a string, or one device’s strings.
- Measure the temperature difference. Sitemark uses the module’s maximum minus its average. Raptor Maps writes "higher than adjacent areas".
- Check the visible image for a cause. Scopito cross-checks thermal and visible images for "an environmental artifact, or something as simple as a shadow or reflection".
- Assign a severity and an action, then review. Sitemark lists 10 actions, from Quick fix to Do Nothing. At Scopito, analysts set the severity.
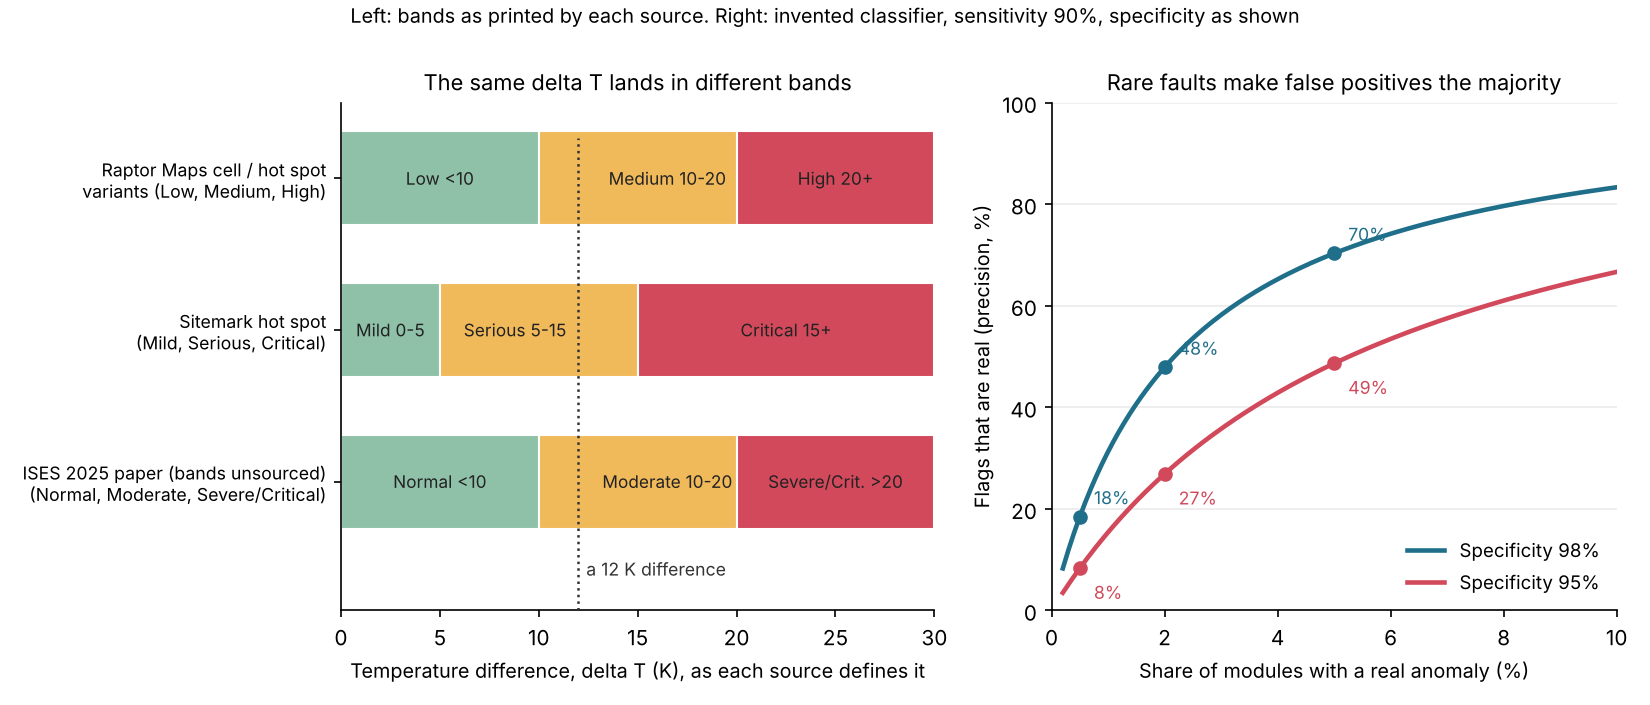
Figure 1. Left: Raptor Maps, Sitemark and ISES 2025 paper bands. Sitemark’s differ from the other two, and the 20 K boundary reads "20+" in one and ">20" in another (Raptor Maps, then the paper). With 2% or fewer faulty modules, most flags are false even at 98% specificity (right panel example).
Worked example: severity bands, then precision and recall
These examples use example inputs. The same finding gets different bands under different schemes. First, five findings with example delta T values, at an example irradiance of 700 W/m2.
Raptor Maps’ glossary prints bands for its Cell, Hot Spot and Junction Box types. Low is under 10 °C, Medium is 10 to 20 °C, and High is 20 °C "higher than adjacent areas". We apply them to any hot spot and call them "Raptor-style". Other Raptor Maps types list only a default priority. "Sitemark-style" uses the hot spot bands Mild, Serious and Critical: 0 to 5, 5 to 15, 15 or more. Normalised delta T is 1000 ÷ GTI × delta T, a formula Sitemark prints.
| Delta T (K, example) | Band as measured (Raptor-style / Sitemark-style) | Normalised delta T (K) | Band on normalised (Raptor-style / Sitemark-style) |
|---|---|---|---|
| 4 | Low / Mild | 5.7 | Low / Serious |
| 8 | Low / Serious | 11.4 | Medium / Serious |
| 12 | Medium / Serious | 17.1 | Medium / Critical |
| 17 | Medium / Critical | 24.3 | High / Critical |
| 22 | High / Critical | 31.4 | High / Critical |
The labels split on the same finding. Sitemark defines Mild as monitor. Serious means replace at the next maintenance. Critical means act as soon as possible. A 12 K module is Medium in one scheme and Serious in the other. Sitemark’s Multi Hot Spot bands are 2.5 and 7.5 K. Neither company page says if its bands use the raw or the normalised value.
Next, an example inspection of 20,000 modules. An analyst checked every finding against the visible image and set the true class. A false negative here is a real finding without the right class. It was missed or mislabelled.
| Class (example counts) | Flagged | Correct / wrong / missed (TP / FP / FN) | Precision / recall |
|---|---|---|---|
| Hot spot | 144 | 118 / 26 / 22 | 81.9% / 84.3% |
| Bypass diode / substring | 117 | 105 / 12 / 15 | 89.7% / 87.5% |
| String offline | 15 | 14 / 1 / 0 | 93.3% / 100.0% |
| Soiling or shading | 118 | 88 / 30 / 32 | 74.6% / 73.3% |
| Junction box | 33 | 24 / 9 / 6 | 72.7% / 80.0% |
| All classes | 427 | 349 / 78 / 75 | 81.7% / 82.3% |
Precision is correct flags ÷ all flags. Recall is correct flags ÷ real findings. Soiling or shading and junction box rank lowest on both. Precision also depends on how rare faults are. Now take a yes-or-no classifier on another example 20,000 modules. It has example 90% sensitivity and 98% specificity.
| Real anomalies (example) | Real flags | False flags | Precision at 98% specificity | Precision at 95% specificity |
|---|---|---|---|---|
| 0.5% (100 modules) | 90 | 398 | 18.4% | 8.3% |
| 2% (400 modules) | 360 | 392 | 47.9% | 26.9% |
| 5% (1000 modules) | 900 | 380 | 70.3% | 48.6% |
At 2%, 98% specificity still gives 392 false flags against 360 real ones.
Anomaly classification checker
Enter a delta T and irradiance, a class’s counts, or your inspection size and rates. It returns bands under two schemes, precision, recall, F1 and false flags. The defaults are example.
IEC TS 62446-3 includes a matrix for thermal abnormalities but no pass/fail criteria
The IEC webstore abstract lists requirements for "personnel qualification and a matrix for thermal abnormalities as a guideline for the inspection". It is edition 1.0, dated 2017-06-15. Only the abstract is used here.
- No pass or fail: IEA PVPS Task 13 (2018) says IEC technical specifications "do NOT include pass/fail criteria" for test results. It says this one is not meant to set them for modules. It ends with reporting requirements and "a Table for qualitative interpretation of IR images and failure modes". That table is not reproduced here.
- Bands in a paper that cites it: an ISES 2025 paper defines delta T as Tmax minus Tavg, "Following IEC TS 62446-3". It cites the standard only for that formula. It uses Normal (under 10 °C), Moderate (10 to 20 °C) and Severe/Critical (over 20 °C).
- A different reading: an inspection firm’s undated sample report, with placeholder values, says IEC 62446-3 "classifies anomalies by type/pattern". It calls its 10 and 20 °C tiers "an operator triage convention", "not an IEC-mandated threshold".
These sources disagree on bands. The webstore lists a stability date of 2026, so check the IEC site for a newer edition. Treat bands as your own and state them in the report.
Why do classifiers get it wrong?
They mix up look-alikes and struggle with rare or varied classes. The figures below use different data, so do not compare them directly.
- Look-alikes: Tsanakas and Marechal (EPJ Photovoltaics 16, 24, 2025) say soiling or shading can look like a hot spot. PID can be mistaken for multi-hotspot patterns. Most of their false positives came from not linking visible and infrared images.
- Test site against live plant: the same paper reports about 89% of anomalies diagnosed right. It found 9.7% false negatives and 1.7% false positives at its test site. In a 62 MW demonstration in Spain, both error rates went over 20%, with no exact figure.
- Class count: Gallmetzer and others (EPJ Photovoltaics 16, 23, 2025) used 20,000 images of 24 x 40 pixels. ResNet50 reached 0.61 accuracy on 11 classes and 0.86 on 5. The 5-class test kept offline module, hot spot, multi-hot spot, diode and multi-diode. It left out six classes. The paper explains why for four: shadowing, vegetation, soiling and cracking show "high variation in the infrared patterns". GPT-4o scored 0.10 to 0.24 on 11 classes.
- Physical noise: IEA PVPS Task 13 says to avoid or reduce reflections. It adds that up to 8 K can arise across a module naturally.
How solar software handles anomaly classification
Raptor Maps, Sitemark and Scopito document classification. The DroneDeploy and Above Surveying pages do not. The table rates only what each page says.
| Software | Classifies by type and severity? | Output | Source and date |
|---|---|---|---|
| Raptor Maps | Yes (type and priority, method not stated) | Anomalies geotagged on a map-based digital twin. | Glossary, copyright 2025. Inspections page, undated. October 2026 |
| Sitemark | Yes | CSV anomaly report, PDF operation report, TIF orthomosaic. | Help pages: types 22 September 2026, properties 8 January 2024, results 10 February 2026 |
| Scopito | Yes | PDF and CSV with imagery, temperature values, annotations and locations. | Solar page, updated 17 November 2025. October 2026 |
| DroneDeploy | Not stated | Not stated | Thermal Mapping help page, undated. October 2026 |
| Above Surveying (SolarGain) | Not stated | Not stated | pv magazine, 6 December 2024. No company page used |
Not stated: the page we cite does not describe classification or output. DroneDeploy’s help page only says annotations can mark offline or deficient panels. The Above Surveying article lists drone thermography data.
- Raptor Maps: the glossary lists 26 anomaly names (41 rows with Low, Medium, High variants) with default priorities. Neither Raptor Maps page says whether a class is set by AI or an analyst. The aerial inspections page says "Granular classification of anomalies enables stronger prioritization".
- Sitemark: types include hot spots, bypassed substrings, diodes, PID, strings, combiner box, inverter and junction box. "All anomalies detected are automatically classified into different severity levels" (Mild, Serious, Critical).
- Scopito: AI and human analysis. Thermal and visible images are cross-checked, and analysts classify findings and assign severity levels.
Common mistakes with anomaly classification
FAQs
What is a false positive in an inspection report?
It is a flag on a healthy module, or on a look-alike such as soiling or shading. Each one sends a crew to a module that needs no repair.
Does IEC TS 62446-3 set severity levels?
No. IEA PVPS Task 13 says the IEC specifications give no pass or fail criteria. An ISES paper uses 10 and 20 °C bands but cites the standard only for the delta T formula. A sample report calls such bands a convention.
What are the severity levels in an inspection report?
It depends on the company. Sitemark’s hot spot bands are Mild (0 to 5 K), Serious (5 to 15 K) and Critical (15 K or more). Raptor Maps’ hot spot bands are Low (under 10 °C), Medium (10 to 20 °C) and High (20 °C higher than adjacent areas).
What is delta T?
Delta T is the temperature difference between a finding and its reference. Sitemark uses the module’s maximum minus its average. An ISES 2025 paper defines it as Tmax minus Tavg.
Is soiling an anomaly?
Raptor Maps lists Soiling as an anomaly with a default Low priority. Sitemark says an Obstruction, such as vegetation hiding panels, is "not an anomaly but just a warning". See soiling.
Related terms
- Thermal inspection: thermal imaging of an array.
- IEC 62446-3: the thermography standard.
- Soiling: a common look-alike.
Next step: pick a tool that states its severity bands in the best solar thermal inspection software.
Sources
All sources checked October 2026.
- Standard and guidance. IEC webstore, IEC TS 62446-3:2017 (abstract, edition 1.0, 2017-06-15, stability date 2026, re-read 30 October 2026). IEA PVPS Task 13, Review on IR and EL Imaging for PV Field Applications (2018).
- Papers. Santana and others, Hot Spot Patterns in Photovoltaic Modules (ISES SWC 2025). Gallmetzer and others, EPJ Photovoltaics 16, 23 (2025). Tsanakas and Marechal, EPJ Photovoltaics 16, 24 (2025). Nadir sample solar thermal report (undated).
- Companies. Raptor Maps anomaly glossary (undated, copyright 2025, bands re-read 30 October 2026). Raptor Maps aerial inspections. Sitemark thermal anomaly types. Sitemark anomaly properties. Sitemark analysing results. Scopito. DroneDeploy Thermal Mapping. pv magazine on Above Surveying.
Last updated 30 October 2026. Next scheduled review: 30 January 2027.