Key takeaways
- The 4 open stages are Qualified, Site assessed, Proposal sent and Decision. Each needs an exit rule, which is evidence in the record that a deal may move on.
- In this example’s pipeline, 74 open deals are worth 1,334,000 USD.
- Weighted by guessed stage chances, that is 366,600 USD. Weighted by rates from history, it is 315,813 USD, so the guessed figure is 16.1% higher.
- Coverage depends on what you count. Against an example 300,000 USD target, all open value gives 4.45 times. Proposal sent and Decision alone give 1.55 times.
- In the example, 22 of 74 deals (29.7%) are past a stage-age rule. Stale deals inflate every total until someone closes or moves them.
To hold stage rules and stage probabilities in a CRM, see the best solar CRM software and the best solar sales software.
Sales pipeline at a glance
A pipeline answers one question: which deals are open, where is each, and what must happen next?
| Item | Detail |
|---|---|
| What it holds | Opportunities from qualification to decision, each with stage, value, owner and expected close date. Enquiries not yet qualified stay in lead management. Signed jobs move to project workflow. |
| Numbers it produces | Open value, weighted value, stage win rates, coverage against a target, stale deals and sales velocity. That is 6 numbers, and each needs its basis stated. |
| Pipeline or funnel | Firms use the words differently. Pipeline here means the open deals today. Funnel means conversion from past cohorts. |
| Standard or rule | None. Each firm sets its own stages and exit rules. |
| In software | CRMs show the pipeline as a board or list with stages. Some add a probability per stage. See the software table. |
Why a sales pipeline matters for installers
A pipeline shows which deals need a call today and whether the target is covered. Without stage rules, two reps file the same deal in different stages, and every total is wrong.
It starts where lead management ends. An enquiry becomes an opportunity once it is qualified. See lead scoring. It ends at a signed contract, when work moves to project management. The stages here match the close rate page’s funnel events. Site assessed is its Appointment held, and Proposal sent is its Proposal issued. The solar CRM page covers the opportunity record. The close rate page covers the counting bases for win rates.
Which stages should a solar sales pipeline have?
This example uses four open stages, plus Won and Lost. Add a stage only when you would act differently on deals in it.
| Stage | A deal enters when | Exit rule: evidence to move on |
|---|---|---|
| Qualified | A decision maker, a site and a bill or usage figure are on record. | A site visit or video call is booked, with a date. |
| Site assessed | The visit or call has happened. | Site notes and photos are saved, and a price is built from the design. See site survey. |
| Proposal sent | The customer has the priced proposal. See solar proposal software. | The customer has agreed in principle. If they asked for changes, the deal stays in Proposal sent until they agree. |
| Decision | The customer agreed in principle. Finance or approval may be pending. | A contract is signed, and the deposit if you require one. See e-signature. |
| Won | The deal leaves Decision with the signing on record. | A project record opens. |
| Lost | The customer declines, buys elsewhere or stops replying after your last follow-up. | A lost reason is chosen from a fixed list, with a date to recontact. |
An exit rule must be something a manager can see in the record. "Customer seems keen" is a feeling. "Customer replied to the proposal on 12 March" is evidence.
Keep three lists apart: lead status (enquiry handling), pipeline stage (where the sale stands) and project workflow (delivery). Company defaults differ from this page. HubSpot’s default deal pipeline has seven stages, from Appointment scheduled to Closed lost.
How do you count a sales pipeline?
Six numbers describe a pipeline, and each needs its basis written beside it. Most come from the open deals. Stage win rate and, in this page’s method, weighted value and velocity also need history.
- Open value: the sum of the deal values across open stages.
- Weighted value: for each stage, open value multiplied by the stage win probability, then summed.
- Stage win rate: deals won divided by deals that entered the stage, from cohorts old enough to be finished. Timing and denominators are on the close rate page.
- Coverage: open value divided by the target for the period. Count only deals with an expected close date inside that period.
- Stale deals: open deals that have sat in a stage longer than the rule you set for it.
- Sales velocity: opportunities multiplied by average deal value and win rate, divided by sales cycle length. That is the formula as Salesforce prints it.
Worked example: 74 open deals, three values
The table below shows an example installer’s open pipeline. All values, win rates, ages and the target are example. All open deals are assumed to carry an expected close date inside the period.
| Stage (example) | Open deals at average value (USD) | Open value (USD) | Guessed win chance | Stage-age rule and stale deals |
|---|---|---|---|---|
| Qualified | 30 deals at 17,000 | 510,000 | 10% | 7 days. 9 stale |
| Site assessed | 20 deals at 18,000 | 360,000 | 25% | 14 days. 5 stale |
| Proposal sent | 16 deals at 19,000 | 304,000 | 40% | 14 days. 6 stale |
| Decision | 8 deals at 20,000 | 160,000 | 65% | 21 days. 2 stale |
| Total | 74 deals at 18,027 | 1,334,000 | 22 stale |
History comes from finished cohorts, those old enough for every deal to have closed or been lost. In them, 48 deals were won. A stage win rate is those 48 divided by the deals that entered the stage.
| Stage (example history) | Entered the stage | Win rate from history | Rate to reach the next step |
|---|---|---|---|
| Qualified | 400 | 12.0% | 60.0% reached Site assessed |
| Site assessed | 240 | 20.0% | 62.5% reached Proposal sent |
| Proposal sent | 150 | 32.0% | 60.0% reached Decision |
| Decision | 90 | 53.3% | 53.3% reached Won (48 deals) |
Now compute the pipeline numbers. The example target is 300,000 USD to sign next period. The example sales cycle is 60 days from Qualified to Won.
| Measure | Working | Result |
|---|---|---|
| Open value | 510,000 + 360,000 + 304,000 + 160,000 | 1,334,000 USD |
| Weighted, guessed chances | 51,000 + 90,000 + 121,600 + 104,000 | 366,600 USD |
| Weighted, history rates | 61,200 + 72,000 + 97,280 + 85,333 | 315,813 USD |
| Coverage, all open value | 1,334,000 ÷ 300,000 | 4.45 times |
| Coverage, Proposal sent and Decision | 464,000 ÷ 300,000 | 1.55 times |
| Coverage, weighted by history | 315,813 ÷ 300,000 | 1.05 times |
| Stale deals and value | 22 of 74 deals. 397,000 of 1,334,000 USD | 29.7% of deals, 29.8% of value |
| Sales velocity | 74 × 18,027 × 12.0% ÷ 60 days | 2,668 USD a day |
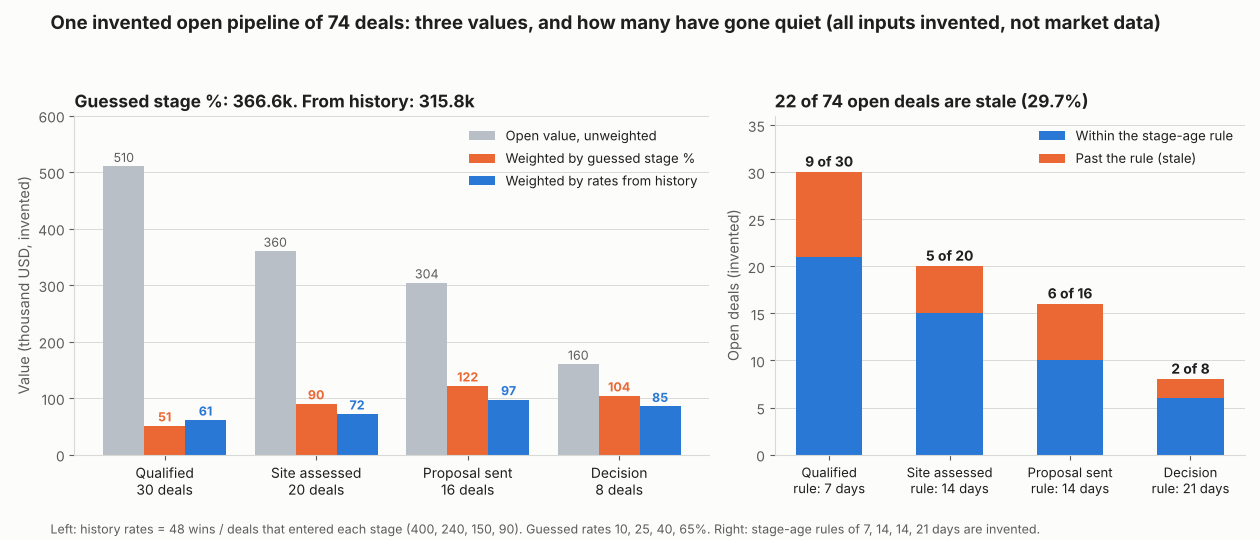
Figure 1. Guessed stage chances put the example pipeline 16.1% above its history-weighted value, and 22 of its 74 deals are past their stage-age rule.
- Guesses run high: the guesses at Proposal sent (40%) and Decision (65%) were above the 32.0% and 53.3% in the history. History rates assume new deals behave like past ones, so treat them as a check.
- Coverage depends on the stages counted: 4.45 times looks safe, but 65.2% of the open value is still at Qualified or Site assessed. Deals at Proposal sent and Decision are won 39.4% of the time by value in this history. To expect the target from those two stages alone, you need 1 ÷ 39.4% = 2.54 times coverage. The example has 1.55.
- A flat win rate understates: the velocity formula applies one 12.0% win rate, measured from Qualified, to all open value. That gives 2,668 USD a day, or 160,080 USD over 60 days. The history-weighted value of 315,813 USD is higher because 34.8% of the open value is already at the last two stages. Use stage rates when the stage mix is skewed.
Sales pipeline value and coverage calculator
Enter your open deals by stage, your own win chances, optional history counts, a target and a cycle length. It returns open value, weighted value, coverage, stale share and velocity.
Not showing? Open the pipeline value and coverage calculator on its own page. It starts with the example above. It warns on unclear numbers, such as 1.000, and on history counts that rise between stages.
How solar software handles the sales pipeline
Three of the five tools document probability per stage. JobNimbus does not, and Sunbase only in part. Stage probability changes the totals, so the table centres on it. It is not a ranking. Company pages read October 2026.
| Software | Stages and boards | Probability and weighted value | Source and date |
|---|---|---|---|
| HubSpot Sales Hub (general CRM) | Yes. The default Sales Pipeline has seven deal stages, you can add stages, and you can create more pipelines. | Yes. Each stage has a probability, used for the weighted amount in board view. | HubSpot knowledge base, set up and customize pipelines, last updated 29 September 2026 |
| Zoho CRM (general CRM) | Yes. Deal stages are the steps of a sales process, and admins can create custom stages. | Yes. Each stage has a probability, also used with the deal amount to calculate expected revenue. | Zoho CRM help, creating deals, no date printed |
| Pipedrive (general CRM) | Not stated. The page covers probability only, adjusted from the pipeline view. | Yes. Stage probability, and a deal probability that overrides it. The default is 100%, so weighted totals equal full totals until changed. | Pipedrive help, probability in Pipedrive, last updated 3 September 2026 |
| JobNimbus | Yes. Workflows hold statuses, each assigned to a stage, and Boards show records by status. | Not stated | JobNimbus help, workflows and statuses, no date printed (2025 copyright) |
| Sunbase | Yes. Pipelines are built around your process, with solar stages from qualification to contract. | Partly. It names expected revenue, close date, pipeline value by team and slowing opportunities. Probability and forecast do not appear. | Sunbase solar CRM page, no date printed (2026 copyright) |
Not stated means the page we read does not say. Partly means the page names some of the feature, but not probability. This table covers pipeline features only, so it differs from the solar CRM page, which covers record types. For ranked options, see the best solar CRM list and the best CRM for solar sales teams.
Common mistakes with a sales pipeline
FAQs
What is the difference between a sales pipeline and a sales funnel?
A pipeline lists the open deals today, each with a stage and value. A funnel shows conversion from past cohorts. Firms use the words differently and no standard settles it, so state which you mean on every report.
How many stages should a pipeline have?
As many as have a distinct exit rule, and no more. This page uses 4 open stages. HubSpot’s default deal pipeline has seven, counting Closed won and Closed lost.
How do I find the win chance for each stage?
Take cohorts old enough to be finished. Divide the deals won by the deals that entered the stage. In our example that is 48 ÷ 90 = 53.3% for Decision. With few deals the rates are noisy, so say how many deals each rate rests on.
What coverage ratio do I need?
No fixed ratio applies. Needed coverage is 1 ÷ the win rate of the deals you count. In this example’s history that is 2.54 times for Proposal sent and Decision. Other stages give a different number. Work it out from your own data.
Related terms
- Solar CRM: the system of record that holds the opportunity and its stage.
- Close rate: contracts signed divided by a named starting count.
- Lead management: the steps an enquiry passes through before it reaches the pipeline.
Next step: run your own open deals through the calculator above and see which stages carry your coverage. Then compare tools in the best solar sales software list or the best solar sales apps for reps.
Sources
- HubSpot knowledge base: set up and customize pipelines, last updated 29 September 2026 (checked 30 October 2026).
- Zoho CRM help: creating deals, no date printed (checked 30 October 2026).
- Pipedrive help: probability in Pipedrive, last updated 3 September 2026 (checked 30 October 2026).
- JobNimbus help: what is a workflow and what are statuses, no date printed (checked 30 October 2026).
- Sunbase: solar CRM software, no date printed (checked 30 October 2026).
- Salesforce blog: sales velocity, published 12 March 2024, formula as printed (checked 30 October 2026).
Last updated 30 October 2026. Next scheduled review: 30 January 2027.