Key takeaways
- In this example’s month, the same 21 contracts are 4.2% of 500 leads, 14.0% of 150 appointments set, 20.0% of 105 held and 25.0% of 84 proposals.
- Conversion rate is any stage-to-stage rate. Close rate usually means the last step, to a signed contract. Tools label them differently.
- Timing changes the rate. In this example’s lag, when monthly leads rise from 400 to 600, the period rate falls to 3.1% in May while the cohort rate stays 4.2%.
- Cost per closed deal is 1,702 USD (20,000 lead spend plus 15,750 sales cost, over 21 contracts). It would be 1,419 USD at 30% proposal-to-close.
- Of the five tool pages read, only JobNimbus prints a close-rate formula with its timing rule. Pipedrive prints a lead-to-deal formula.
To track close rate by stage in software, see the best solar CRM.
Close rate at a glance
Close rate is contracts signed divided by a starting count. The skill is choosing the count and the period before you divide.
| Item | Detail |
|---|---|
| Formula | Close rate (%) = contracts signed ÷ starting count × 100. |
| Starting count | Leads, appointments set, appointments held or proposals issued. That is 4 options, and each gives a different rate. |
| Close rate or conversion rate | Conversion rate can be any stage-to-stage rate. Close rate is usually the final step. Companies and tools differ. This is our framing, not a standard. |
| Win rate | Kellblog defines a narrow win rate as wins ÷ (wins + losses), which leaves out deals still open or derailed. A broad version adds derails to the divisor. |
| What counts as closed | Pick one event, such as a signed contract, and use it in every report. Decide separately how to treat cancellations. This is our suggestion. |
| In software | Tools show a percentage, but their formulas and timing rules differ. See the software table below. |
Our KPI dashboard page defines close rate as contracts ÷ proposals and lead-to-close as contracts ÷ leads. This page names the starting count each time.
Why the denominator changes the answer
The same contracts give a different rate for each starting count. Each count answers a different question, so a rate quoted without one cannot be compared.
| Starting count | Question it answers | Watch for |
|---|---|---|
| Leads (lead to close) | Does the whole path, from source to signature, work? | Mixes lead quality with selling skill. Leads never contacted count against it. See speed to lead. |
| Appointments set | How well do booked meetings turn into sales? | No-shows and cancellations count against the closer. A setter shapes this number. |
| Appointments held | How well does the closer sell once the meeting happens? | Hides a no-show problem. Report it next to the set-to-held rate. |
| Proposals issued | How well do proposals turn into contracts? | Depends on when you count a proposal as issued: drafted, sent or shown. |
The common funnel names follow from this. Lead-to-appointment is appointments divided by leads. Appointment-to-close is contracts divided by appointments. Always name which appointment count you used, set or held.
The five funnel stages and what counts at each
A solar funnel has five events you can count. Write down what counts at each, or two reps will count differently.
- Lead: an enquiry with a recorded source. See lead management.
- Appointment set: a date and time agreed with the customer.
- Appointment held: the meeting took place, in person or by video.
- Proposal issued: the customer has been sent or shown a priced proposal.
- Contract signed: the customer has signed.
These definitions are our suggestion, not a standard. If you sell without meetings, enter the proposal count for both appointment rows in the calculator below.
How to calculate close rate
Pick a question, a starting count and a period. Then count the contracts that came from that group. These steps keep the maths honest.
- Choose the question: judge a lead source, a setter, a closer or a proposal.
- Choose the starting count that matches it, from the table above.
- Choose the group: for example, all leads created in one month.
- Count the contracts from that group, however late they signed, then divide.
Step 4 is the cohort method, explained under timing. A young cohort is unfinished, so its rate will rise.
Worked example: one funnel, four close rates
An example installer receives 500 leads in a month and signs 21 contracts from them. Every count and cost here is example.
| Stage (example) | Count | Rate from previous stage | Close rate on this count |
|---|---|---|---|
| Leads | 500 | 4.2% | |
| Appointments set | 150 | 30.0% of leads | 14.0% |
| Appointments held | 105 | 70.0% of set | 20.0% |
| Proposals issued | 84 | 80.0% of held | 25.0% |
| Contracts signed | 21 | 25.0% of proposals |
Now add example costs. Lead spend is 20,000 USD. Sales cost is 150 USD per appointment held (rep time and travel). Design, permit and install costs are left out.
| Cost line (example) | Working | USD |
|---|---|---|
| Lead spend | Given | 20,000 |
| Sales cost | 105 held × 150 | 15,750 |
| Total | 20,000 + 15,750 | 35,750 |
| Cost per closed deal, lead spend only | 20,000 ÷ 21 | 952 |
| Cost per closed deal, lead spend plus sales cost | 35,750 ÷ 21 | 1,702 |
| What-if at 30% proposal-to-close | 35,750 ÷ (84 × 0.30 = 25.2) | 1,419 |
The what-if holds every cost fixed and is arithmetic, not a forecast. For cost per contract across several lead sources, see lead management and cost per lead.
Cohort or period: timing changes the rate
A cohort rate follows one group of leads until they close or are lost. A period rate divides contracts signed this month by leads received this month. They agree only when lead volume is steady.
Tools differ here. JobNimbus Insights counts leads collected in the period. It says a Sold Job from a lead collected in a previous month "would not be included". That is a same-month cut-off. Sales that close in a later month are not credited, so it understates a slow cohort. Its Estimating Conversion counts jobs that entered the Estimating Stage in the timeframe and reached Sold within the same timeframe. Pipedrive’s deal reports default to deals created this year.
Kellblog (post dated 9 November 2017) separates two methods. Milestone analysis counts what passes each quarter. Flow (cohort) analysis follows a cohort of opportunities over time.
This example’s installer signs a cohort’s contracts in months 0 to 4 after the lead month. The shares are 20%, 35%, 25%, 12% and 8%. Every cohort ends at 4.2%.
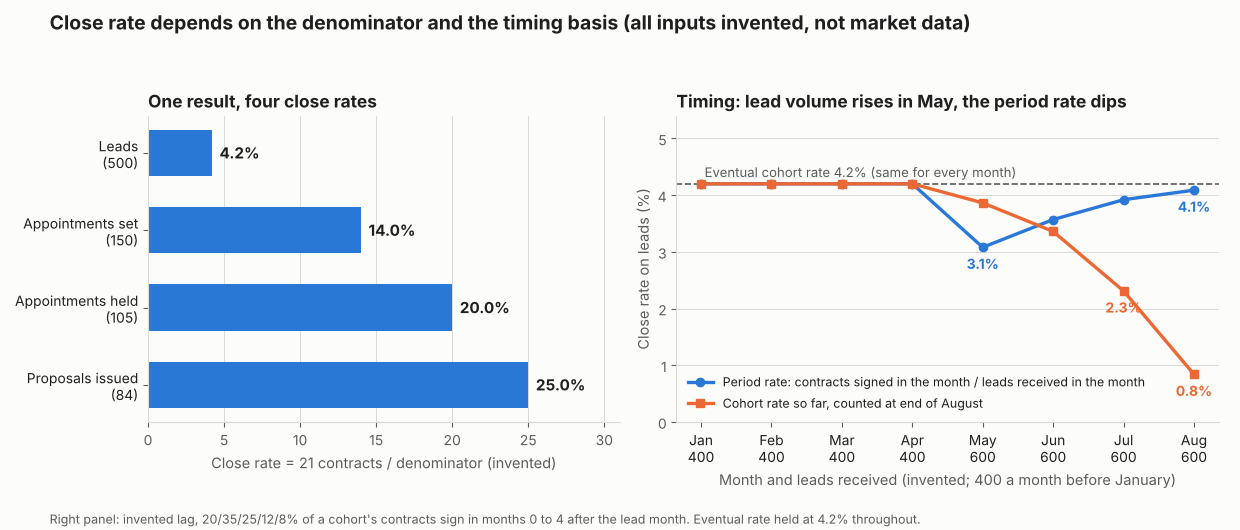
Figure 1. In this example, the same 21 contracts read 4.2% to 25.0% by starting count. A rise from 400 to 600 leads a month pulls the May period rate to 3.1%, while the cohort rate stays 4.2%.
When volume rises, this month’s contracts come from smaller, earlier cohorts, so the period rate dips below the cohort rate. A young cohort, such as August at 0.8% in its first month, is an unfinished result. In this example lag, 92% of a cohort’s contracts have signed by month 3.
Use cohort rates for cohorts older than your usual sales cycle. Use the period rate as a quick signal. Find your own lag from the dates between lead and signature.
Close rate and cost per closed deal calculator
Enter the counts for one lead cohort, plus lead spend and sales cost. It returns close rates on each starting count and the cost per closed deal.
Not showing? Open the close rate calculator on its own page. It starts with the example above. It warns on blank, negative, fractional or ambiguous numbers such as 1.000. It also warns on a count larger than the stage before it.
What drives close rate
Close rate moves at the stage where the cause acts, so split the funnel before you change anything. The table is our framing, not evidence of effect size.
| Driver | Stage it moves | Where to look |
|---|---|---|
| Lead source and qualification | Lead to appointment. Appointment to close | Lead scoring, shared and exclusive leads |
| Response time and follow-up | Lead to appointment set | Speed to lead, nurture sequences |
| Who runs the appointment | Set to held. Held to proposal | Appointment setting, lead routing |
| Proposal quality, visuals and price | Proposal to close | Interactive web proposals, 3D solar design software, pricing per watt |
How solar software handles close rate
Each of the five tools shows some conversion or win figure, but only two print a formula. We read the company pages in October 2026. The table gives the answer for each tool, and the list below gives the detail.
| Software | Close or conversion report? | Denominator and timing stated? | Source and date |
|---|---|---|---|
| JobNimbus | Yes | Yes | JobNimbus help, how Insights calculates data, no date printed (2025 copyright) |
| Pipedrive | Yes | Partly | Pipedrive help, lead conversion and deal conversion reports, both last updated 3 September 2026 |
| HubSpot Sales Hub | Partly | Not stated | HubSpot knowledge base, sales reports in the sales analytics suite, last updated 18 June 2026 |
| Zoho CRM | Partly | Not stated | Zoho CRM sales funnel page, no date printed |
| Solargraf | Partly | Partly | Solargraf help centre, analytics dashboard, published 25 March 2026 |
Not stated: the company page we cite does not say. Partly: the page covers only part of it. What each page says:
- JobNimbus: Insights Sales Dashboard defines Close Rate and Estimating Conversion. Close Rate uses all Leads collected in the period and the Sold Jobs from them in the same month. Estimating Conversion uses jobs that entered the Estimating Stage in the timeframe and reached Sold within the same timeframe.
- Pipedrive: A lead conversion report and deal funnel and win/loss reports. The funnel chart shows "Your overall win rate" at the top. The lead report gives "(converted leads × 100%) ÷ total leads". The deal reports state no formula. The default filter is deals created this year.
- HubSpot Sales Hub: The deal funnel report includes conversion rates between stages. The deals won and lost report shows counts, not a rate. Customising the deal funnel needs Sales Hub Enterprise.
- Zoho CRM: The funnel chart page defines "overall conversion rate" and lists calculating deal win rate across stages. It gives no formula for stage rates or win rate, and no timing basis.
- Solargraf: The Analytics Dashboard has a "Proposals Signed" card. The article calls it "close rate" only in advice text. No card is labelled close rate. Cards split into projects created in the current month and project status in the current month. No formula. Account owners only.
HubSpot, Zoho CRM and Pipedrive are general CRMs. Ratings differ from our KPI dashboard and lead management pages because each page rates a different feature. For ranked CRMs for solar teams, see the best solar CRM.
Common mistakes with close rate
FAQs
What is the difference between close rate and conversion rate?
Conversion rate is the wider term for any stage-to-stage rate, such as lead to appointment. Close rate usually means the last step, to a signed contract. Some tools use the words differently, so check the definition.
What is a good close rate?
There is no single good rate, because the starting count changes the result. No source we read prints a benchmark with its starting count and timing basis, so this page gives none. The example reads the same contracts four ways. Compare your own cohorts by lead source and by rep first.
Should no-shows count in close rate?
Count them in rate on appointments set, but not in rate on appointments held. Report both with the set-to-held rate, which was 70.0% in our example. That shows how many booked meetings never happened.
Does a contract cancelled after signing count as closed?
Decide in writing and use one rule. Report both gross signed contracts and contracts that stay signed, so the gap is visible. Commission plans may treat cancellations separately. See clawback.
Related terms
- Sales pipeline: the stages an opportunity passes through, from proposal to contract.
- KPI dashboard: a single view of the sales and project numbers you track.
- Cost per lead: what you pay for each enquiry, before any sale.
Next step: once you have fixed your starting counts, compare rep reports in the best solar sales software. To compare rates by lead source, see the best solar lead generation software.
Sources
- JobNimbus help: how does Insights calculate my data on the Sales Dashboard, no date printed (checked October 2026).
- Pipedrive help: Insights reports, lead conversion, last updated 3 September 2026 (checked October 2026).
- Pipedrive help: Insights reports, deal conversion, last updated 3 September 2026 (checked October 2026).
- HubSpot knowledge base: create sales reports in the sales analytics suite, last updated 18 June 2026 (checked October 2026).
- Zoho CRM: sales funnel charts, no date printed (checked October 2026).
- Solargraf help centre: analytics dashboard, published 25 March 2026 (checked October 2026).
- Kellblog: Win Rates, Close Rates and Milestone vs. Cohort Analysis, post page dates it 9 November 2017 (checked 30 October 2026). Also listed on the Kellblog archive and Engineered.at, which dates it 9 November 2017.
Last updated 30 October 2026. Next scheduled review: 30 January 2027.