Key takeaways
- Capacity factor = annual energy ÷ (rated capacity × hours). A year is 8,760 hours, or 8,784 in a leap year. AC basis = DC basis × DC/AC ratio.
- The same energy is 16.89% on the DC basis and 21.96% on the AC basis (example plant, ratio 1.30).
- Mixing the bases in a revenue model moved example year-1 revenue by +30.0% or -23.1%. NREL’s ATB says LCOE matches only when the other inputs share the rating.
- A year-1 factor held flat for 25 years overstates energy. With 0.5% yearly degradation (example), the 25-year mean AC factor is 20.69%, not 21.96%.
- Published factors differ in basis, period and energy boundary. State all three before you compare.
To get capacity factor from a simulation, see the best solar simulation software. For revenue and LCOE use, see the best solar financial modeling software.
Capacity factor at a glance
Capacity factor compares real energy with a perfect-output ceiling. It is a ratio between 0% and 100%. The ceiling depends on which rating you divide by.
| Item | Detail |
|---|---|
| Formula | Capacity factor = annual energy (kWh) ÷ (rated capacity (kW) × 8,760 h). |
| Unit and range | A percentage. The DC basis is never above the AC basis when DC/AC is 1.0 or more. See the benchmarks section for one published sample. |
| Where it matters | Revenue and LCOE inputs, comparing plants, checking a simulation against meter data. |
| Standard or rule | No single rule fixes the basis. SAM help, NREL ATB and PVWatts each state their own (see the benchmarks table). NREL’s ATB (Equations and variables, an older version) defines it as "Generally, the ratio of actual annual output to output at rated capacity for an entire year." |
| In software | SAM and PVWatts print it. PVsyst, HelioScope and Aurora do not on the company pages checked. |
Why capacity factor matters for installers and analysts
Capacity factor is the short form of "size × hours × yield". Finance models, lenders and benchmark reports all use it. So a wrong basis becomes a wrong price or a wrong comparison.
In a model, energy = rated capacity × 8,760 × capacity factor. Revenue and the LCOE denominator follow from that energy. Our financial modelling and project finance model pages start the chain from kWh per kWdc instead. This page shows the same chain in capacity-factor form. It also shows what breaks when the basis slips. For the uncertainty on the energy, see P50, P90 and P99.
How to calculate capacity factor and convert it
Divide a year of energy by the rating times the hours. To change basis, multiply or divide by the DC/AC ratio. To start from kWh/kWp, divide by 8,760.
- Take one year of AC energy in kWh. Use a simulation or a meter. State where you measure it.
- Pick the rating. Use module kWp at STC for the DC basis. Use inverter AC kW for the AC basis. See kW and kWp.
- Multiply the rating by the hours: 8,760, or 8,784 in a leap year.
- Divide the energy by that product. The result is the capacity factor on that basis.
- To convert, use the DC/AC ratio. NREL’s ATB page says: "To translate between the two capacity factors, simply multiply or divide by the ILR."
The DC basis equals specific yield ÷ 8,760, because specific yield is energy per kWp. It also equals performance ratio × sunlight on the array plane ÷ 8,760. Performance ratio strips out sunlight. Capacity factor does not. Energy in kWh and power in kW are different units. See kWh.
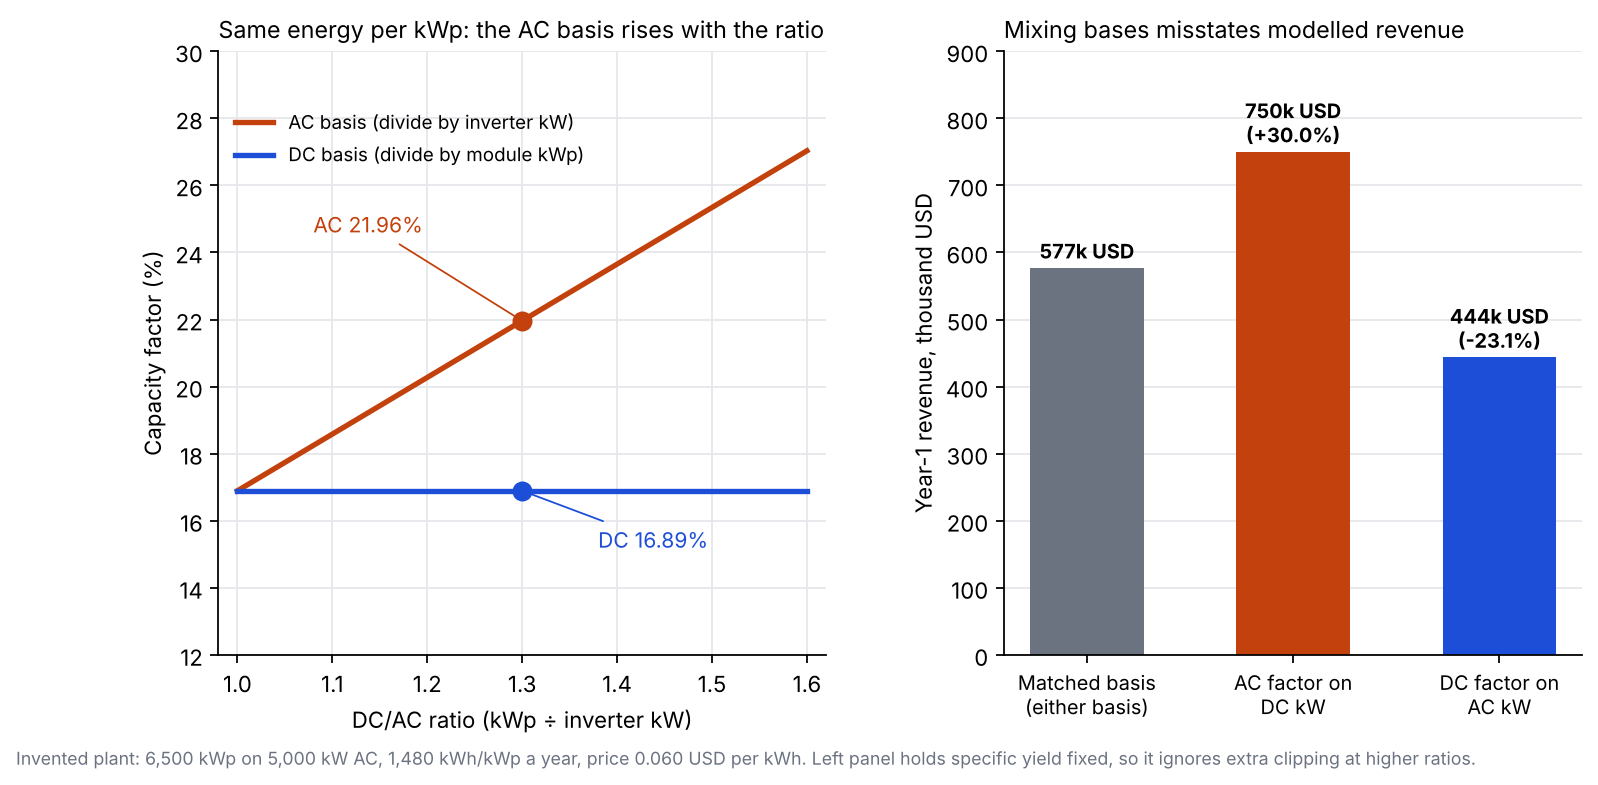
Figure 1. At fixed energy per kWp the AC factor rises with the DC/AC ratio. Applying a factor to the wrong rating misstates revenue by 30.0% or 23.1% (example plant).
Worked example: one plant, two bases, three finance checks
Every input is example. The plant has 6,500 kWp of modules on 5,000 kW of inverters. That is a DC/AC ratio of 1.30. Year-1 AC energy is 1,480 kWh/kWp. We add no extra losses.
Table 1. Conversion from specific yield to both capacity factors (example plant).
| Step | Calculation | Result |
|---|---|---|
| Annual AC energy | 1,480 kWh/kWp × 6,500 kWp | 9,620,000 kWh |
| DC capacity factor | 1,480 ÷ 8,760, or 9,620,000 ÷ (6,500 × 8,760) | 16.89% |
| AC capacity factor | 9,620,000 ÷ (5,000 × 8,760) | 21.96% |
| Full-load hours, AC basis | 9,620,000 ÷ 5,000 | 1,924 h |
| Leap year (8,784 h) | Same energy, DC and AC | 16.85% and 21.90% |
Check 1 is revenue at an example 0.060 USD per kWh. The matched-basis answer is 577,200 USD in year 1. Table 2 applies each factor to the wrong rating.
Table 2. Year-1 revenue with matched and mixed bases (example plant and price).
| Model line | Revenue (USD) | Against 577,200 USD |
|---|---|---|
| DC factor × 6,500 kWp × 8,760 h × price | 577,200 | 0.0% |
| AC factor × 5,000 kW × 8,760 h × price | 577,200 | 0.0% |
| AC factor × 6,500 kWp (wrong rating) | 750,360 | +30.0% |
| DC factor × 5,000 kW (wrong rating) | 444,000 | -23.1% |
Both errors equal the DC/AC ratio: 1.30 above, and 1 ÷ 1.30 below. Check 2 is LCOE. NREL’s ATB says both factors give the same LCOE if the other inputs use the same rating. DC costs over an AC factor understate it by 23.1% (example inputs). See LCOE.
Check 3 is the life of the plant. Assume an example 0.5% yearly degradation from year 2, so the AC factor falls from 21.96% in year 1 to 19.47% in year 25. The 25-year mean is 20.69%. Holding 21.96% flat overstates 25-year energy by 6.1%. See degradation rate.
Capacity factor calculator
It converts between energy, specific yield and both capacity factors. Enter module kWp, inverter kW and one known value. The tool returns specific yield and both capacity factors. It also gives full-load hours. Add a price and it shows the revenue check from Table 2. It warns on zero, negative and out-of-range inputs. It does not show a wrong number.
Benchmarks: why published capacity factors often do not match
Published factors differ. The denominator, the energy and the period all vary. A fair comparison matches all of them. Read the method before the number.
Table 3. How five sources set the basis.
| Source | Capacity in the denominator | Energy and period |
|---|---|---|
| NREL ATB, PV AC and DC page (2024 Electricity ATB) | MWAC (inverter sum) or MWDC (module sum). The DC-based factor is lower. | Annual average energy, kWhAC. |
| SAM help, Capacity Factor | PV models: DC nameplate for the DC factor, AC capacity for the AC factor. PVWatts uses the rated inverter size for AC. | First-year output. Formula uses 8,760 h. |
| PVWatts V8 API page | System nameplate in kW. The output is labelled "(AC-to-DC)", the label SAM uses for its DC factor. | Predicted first-year output. |
| LBNL, Utility-Scale Solar 2021 Edition (October 2021, projects online 2007 to 2019) | AC for Figure 4, with a DC equivalent given in text. | Figure 4, labelled cumulative. Curtailment and degradation are included. |
| EIA FAQ 101 (no date printed) | Electric Power Monthly uses time-adjusted summer capacity. Small-scale PV data are reported AC (Today in Energy, 11 July 2017). | Actual output ÷ maximum possible output in the period. |
The LBNL 2021 brief (projects online 2007 to 2019) covers 752 US projects totalling 28.7 GWAC. In AC terms it gives a range of 9% to 36% and a median of 24%. In DC terms it gives 8% to 29% and a median of 18%. The ratio of medians, 24 ÷ 18 = 1.33, is not a fleet DC/AC ratio. It shows how far the basis alone moves a headline number. It is not a target for your plant.
Before you compare two factors, match these five items.
- Capacity basis: DC kWp or AC kW. For AC, say which rating. It could be the inverter or the limit at the grid connection.
- Period: a year, and 8,760 or 8,784 hours.
- Energy boundary: inverter output, meter, or after curtailment.
- Source: measured or simulated, and which weather file. See TMY.
- Age: first-year, or an average over several years with degradation.
A higher ratio lifts the AC factor but adds clipping. See inverter clipping. A plant with a higher AC factor is not always better per module.
How solar software handles capacity factor
SAM and PVWatts print a capacity factor, and both state the basis. The table shows which tools print it and where the company page says so. Ratings follow the company pages named in the last column.
| Software | Prints a capacity factor? | Company page (dates in Sources) |
|---|---|---|
| SAM | Yes | SAM help, "Capacity Factor" |
| PVWatts | Yes | PVWatts V8 API page |
| PVsyst | Not stated | PVsyst help, "Normalised performance index". PVsyst 7 tutorial, chapter 1 |
| HelioScope | Not stated | HelioScope help, "Metrics Bar". "Production Report Summary" |
| Aurora Solar | Not stated | Aurora help, "System Losses". "Running and interpreting storage simulations" |
Not stated: the company pages we cite do not use the phrase capacity factor.
How and where each tool shows it:
- SAM: capacity factor is the first-year electrical output relative to running at nameplate every hour. Detailed Photovoltaic and PVWatts models give both a DC and an AC capacity factor.
- PVWatts: the version 8 API returns capacity_factor, labelled "(AC-to-DC)", beside ac_annual. SAM’s help uses the same label for its DC factor. The dc_ac_ratio input defaults to 1.2.
- PVsyst: the pages print specific production and normalised yields, not capacity factor.
- HelioScope: the Metrics Bar lists Specific Yield. The Production Report Summary names production, performance ratio and kWh/kWp. Neither names capacity factor.
- Aurora Solar: neither help page uses the phrase. A separate Illinois SREC page says "The 16.42% value is a capacity factor for fixed-mount systems", a programme value, not an Aurora output.
For tools that report energy and yield, see the best solar simulation software. For tools with debt and tax blocks, see the best solar financial modeling software.
Common mistakes with capacity factor
The costliest slips are an unnamed basis, mixed ratings and a flat life-long factor.
- Not naming the basis: put the rating, hours and boundary beside each figure. A SAM forum moderator wrote on 31 October 2022 that any use "should be accompanied by a description of how it was calculated".
- Mixing bases in cost per kW: divide cost and energy by the same rating. Table 2 shows a 30.0% or 23.1% revenue error from the wrong one (example).
- Using a year-1 factor for the whole life: the degradation check above shows a 6.1% overstatement. That is in our example case.
FAQs
What is a good capacity factor for solar?
In Berkeley Lab’s 2021 sample of US utility-scale projects, the median was 24% on an AC basis, with a range of 9% to 36%. That brief covers projects online 2007 to 2019 only, and newer editions exist. Compare only on the same basis, and match the sun, tracking and DC/AC ratio too.
Why is the AC capacity factor higher than the DC one?
Because the inverter rating is smaller than the module rating, you divide the same energy by less. AC = DC × ratio. In this example’s plant, 16.89% × 1.30 = 21.96%.
Does a 22% capacity factor mean the plant runs at full power 22% of the time?
No. It is an energy ratio. A plant makes part output for most daylight hours. A factor of 21.96% on 5,000 kW equals 1,924 full-load hours a year (example plant). It does not mean 1,924 hours at rated power.
Should I divide by 8,760 or 8,784 hours?
Use the hours of the period you measure. For one leap year, this example’s plant gives 16.85% and 21.90% instead of 16.89% and 21.96%. SAM’s help formula uses 8,760, so state your convention.
Related terms
- Specific yield: annual energy per kWp. Divide by 8,760 for the DC factor.
- DC/AC ratio: array kWp divided by inverter AC kW.
- Performance ratio: specific yield divided by sunlight on the array.
- Capacity utilisation factor: the Indian name for capacity factor.
Next step: run your plant through a tool from the best solar simulation software and compare its DC and AC factors with Table 1.
Sources
NREL (the National Renewable Energy Laboratory) was renamed the National Laboratory of the Rockies (NLR) in December 2025. Its nrel.gov pages retired in May 2026. This page links to the current nlr.gov addresses and keeps the name NREL for documents published under it.
- EIA, FAQ: difference between electric generation capacity and electricity generation (no date printed on the page. Checked October 2026).
- EIA, Today in Energy, 11 July 2017 (checked October 2026).
- NREL ATB, PV AC and DC (page refers to the 2024 Electricity ATB. Checked October 2026).
- NREL ATB, Equations and variables (page says it is an older version and the 2025 edition is the latest. Checked October 2026).
- SAM help, Capacity Factor (undated, checked 30 October 2026).
- SAM forum, DC vs AC capacity factors, reply dated 31 October 2022 (forum reply, not documentation. Checked October 2026).
- PVWatts V8 API documentation (undated, checked 30 October 2026).
- Bolinger, Seel, Warner and Robson, Utility-Scale Solar, 2021 Edition, Berkeley Lab technical brief, October 2021 (checked October 2026).
- PVsyst help, Normalised performance index and PVsyst 7 tutorial, chapter 1 (both undated, checked October 2026).
- HelioScope help, Metrics Bar (updated May 29, 2026) and Production Report Summary (updated July 09, 2025, checked October 2026).
- Aurora help, System Losses (updated June 29, 2026) and Running and interpreting storage simulations (updated August 17, 2026, checked October 2026).
- Aurora help, Illinois SRECs (no date shown, checked October 2026).
Last updated 30 October 2026. Next scheduled review: 30 January 2027.