Key takeaways
- Seven KPIs cover the path from lead to cash: two for sales, three for delivery and two for money.
- The invented 60-project set has 540 leads and 60 contracts: an 11.1% lead-to-close rate and a 40% close rate.
- Median contract-to-PTO was 90 days for 47 finished jobs, but 13 jobs were still open.
- Gross margin was 26.5% before commission and 20.5% after it. 18 of 60 jobs earned under 20% before commission.
- No independent, dated benchmark was found for these KPIs, so compare against your own trend.
To track delivery and margin KPIs in software, see the best solar project management software.
KPI dashboard at a glance
A solar KPI dashboard pulls sales, project and cost data into seven ratios, counts and times. This page covers business KPIs, not plant output. For plant output, see performance ratio.
| Item | Detail |
|---|---|
| Formulas | Rates (contracts signed ÷ leads or proposals), medians (days), price per watt (price ÷ watts), margin ((price − cost) ÷ price) |
| Units | Percent, hours, days, USD per watt, USD per job, months of backlog |
| Where it matters | Sales management, project delivery, cash flow and pricing |
| Standard | No single standard: each company defines its own start and end dates |
| In software | CRM and project tools report some KPIs. Margin usually needs job costing data |
Why does a KPI dashboard matter for installers?
A dashboard shows a problem while it is still cheap to fix. A falling close rate, a slow design queue or a thin backlog can show up early. That is before it reaches revenue.
It also stops arguments. Sales may say leads are poor. Ops may say install dates slip. Shared definitions settle it. The sales pipeline and job costing pages cover the data that feeds it.
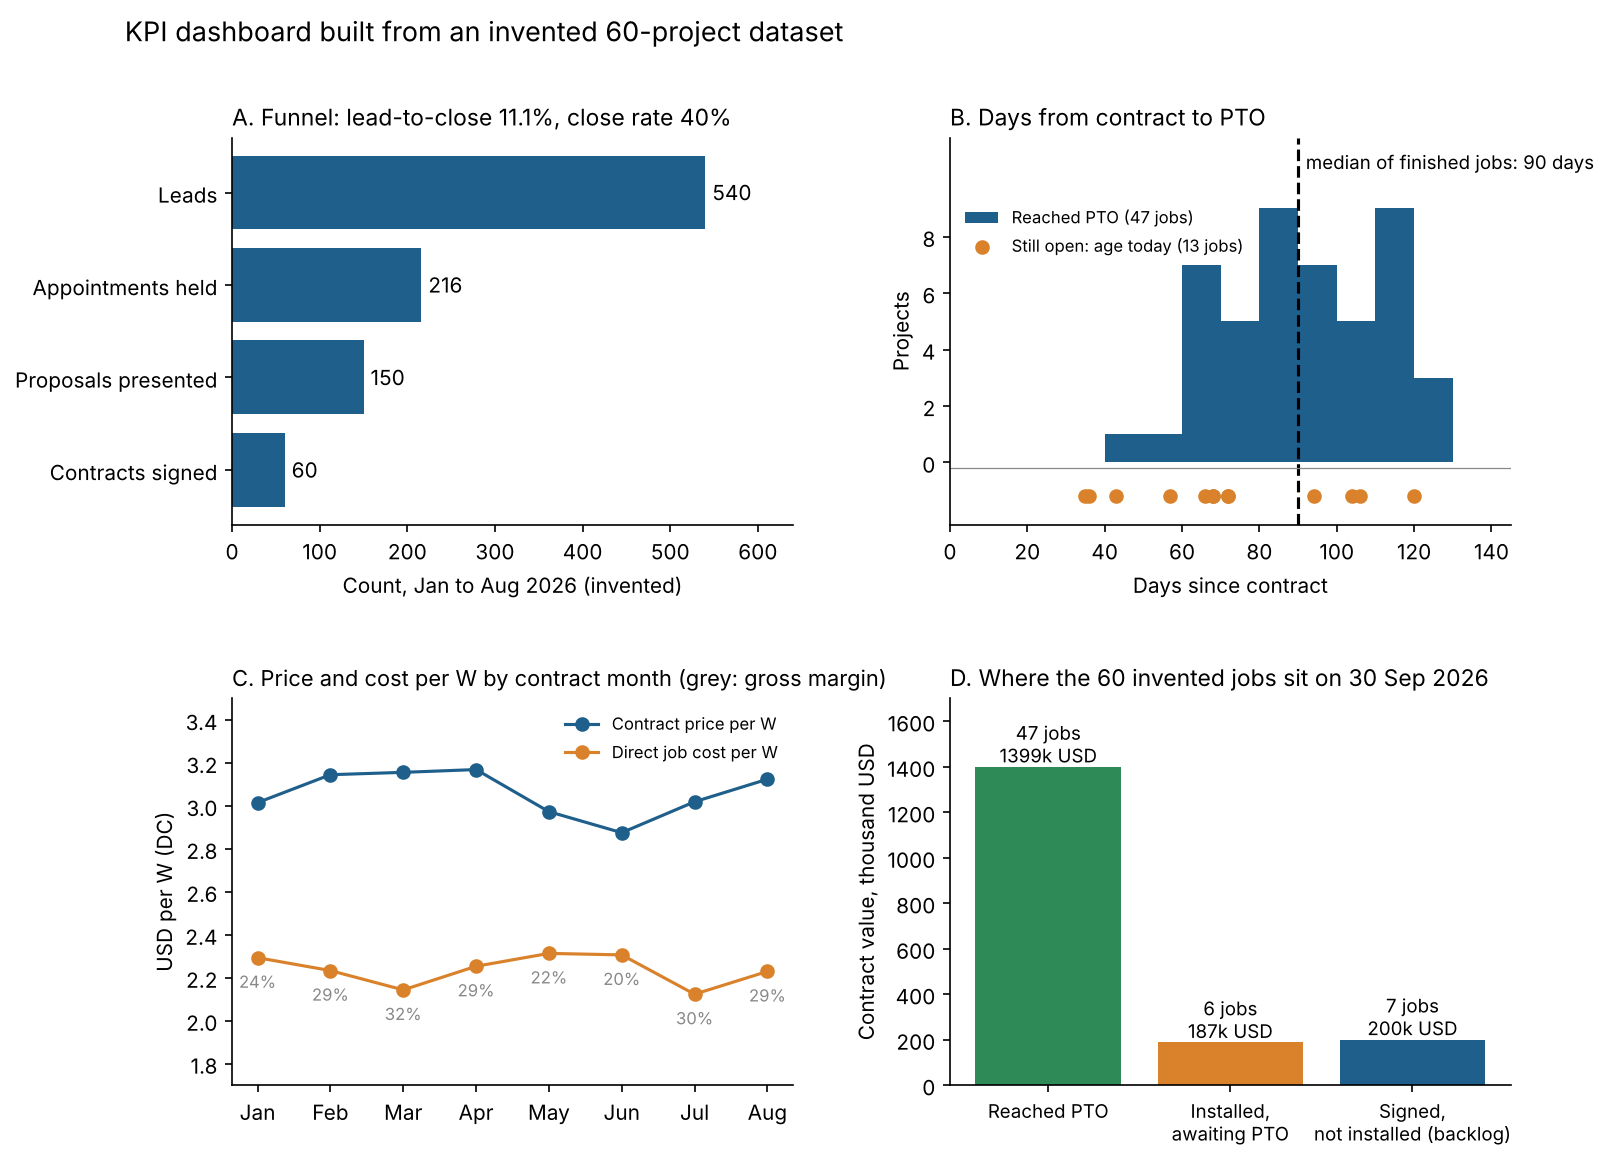
Figure 1. The 90-day PTO median hides 13 open jobs. Monthly gross margin ranges from 20% to 32% by contract month. All data are example.
How do you calculate the seven solar KPIs?
Each KPI is a ratio, a median or a sum. Fix the start date, the end date and the population before you build any chart.
| KPI | Formula | Definition to fix |
|---|---|---|
| 1. Lead-to-close rate | Contracts signed ÷ leads created | Same period, or follow each lead cohort |
| 2. Close rate | Contracts signed ÷ proposals presented | What counts as a proposal. See close rate |
| 3. Design turnaround | Median hours from design request to design delivered | Clock hours or working hours |
| 4. Cost per watt | Price per watt = contract price ÷ DC watts. Cost per watt = direct job cost ÷ DC watts | Which costs are direct. See price and cost per watt |
| 5. Days contract to PTO | Median of (PTO date − contract date) for finished jobs, plus the age of open jobs | Start at contract or at NTP. See PTO |
| 6. Backlog | Contract value of signed, not-yet-installed jobs. Months = backlog ÷ average monthly installed value | Whether installed-awaiting-PTO jobs count |
| 7. Margin per job | (Contract price − direct cost) ÷ price, and the same in USD per job | Before or after commission. See commission tracking |
Use a median for durations. A few stuck jobs distort a mean. For price and margin, add up totals before you divide. That way large jobs weigh more.
Worked example: a 60-project set
This example uses example data. It has 60 signed residential jobs from January to August 2026, read on 30 September 2026. Funnel counts, prices, costs and dates are all made up. Commission is assumed at 6% of price. Direct cost covers equipment, labour and permits, not overhead.
| KPI | Working | Result |
|---|---|---|
| Lead-to-close | 60 ÷ 540 leads | 11.1% |
| Close rate | 60 ÷ 150 proposals | 40.0% |
| Design turnaround | Median of 60 jobs | 24.1 h (mean 27.1 h, 90th percentile 46.4 h, nearest rank) |
| Price per watt | 1,785,810 USD ÷ 585,800 W | 3.05 USD/W |
| Cost per watt | 1,313,090 USD ÷ 585,800 W | 2.24 USD/W |
| Days to PTO | Median of 47 finished jobs | 90 days (range 48 to 129). 13 open jobs aged 35 to 120 days |
| Backlog | 7 jobs, 64.1 kW. 199,590 USD ÷ 213,583 USD per month | 0.93 months |
| Margin per job | Price less cost, 472,720 USD ÷ 60 jobs | 7,879 USD (26.5%). After commission 6,093 USD (20.5%) |
Monthly installed value, by install date, was 131,550, 405,750 and 103,450 USD for July, August and September. That swing is why the example averages three months. The 0.93-month backlog is partly an artefact, because the set has no contracts after August. Another 6 jobs worth 187,240 USD were installed and waiting for PTO.
Timing flatters the PTO median. Of the 10 jobs signed in June, 6 had reached PTO. July is weaker: only 1 of its 6 jobs had, and none of the 4 signed in August. Show finished and open jobs together.
Solar KPI calculator
Enter your own counts and totals, or load the example set to reproduce the table above. The calculator needs totals for the same period and the same jobs. If an input is zero, negative or impossible, it warns you and shows no result.
What does a good KPI dashboard layout look like?
Use one top row with the seven numbers and their change against last period. Below it, show the funnel, the project stages and the margin trend. Figure 1 follows that order.
- Top row: the KPI, its value, its trend and the date range.
- Middle: funnel, stage ageing and per-watt price against cost.
- Drill-down: filter by rep, crew, state and contract month.
- Blockers: list the open jobs past your median. Perceptive Analytics (January 2025) does this for overdue and aging projects.
- Roles: the same source describes separate dashboards for installation, fleet, compliance and project delivery. Solargraf’s dashboard applies global filters across all charts.
Are there benchmarks for these KPIs?
No independent, dated benchmark for installer-level KPIs appears in the sources listed below. Two blogs give ranges without citing a primary source, and the ranges do not agree.
Rework (updated 2 July 2026) gives lead-to-close of 7% to 14% and close rate of 22% to 38%. Perceptive Analytics (published 20 January 2025) says 15% to 25% of leads convert. It also gives PTO-inclusive project timelines of 60 to 120+ days. Rework also gives a gross margin of 45% to 58% for a well-run residential company, again with no source printed. We do not compare it with the example 26.5%, because the cost definitions are unknown. Use your own trend first.
How solar software handles KPI dashboards
Three of the six tools below clearly document a dashboard, one does so partly, and none documents all seven KPIs. Rows follow each company’s own pages, opened in October 2026.
Not stated: the company page we cite does not describe a dashboard in text. Partly: the page claims some dashboard features without detail. For Salesforce Sales Cloud and monday.com, Yes means you build the dashboard yourself.
| Software | Documents a dashboard? | Source |
|---|---|---|
| Solargraf | Yes | Help article, 25 Mar 2026 |
| Salesforce Sales Cloud | Yes | Sales Cloud guided tour |
| monday.com | Yes | Support article, modified 21 Oct 2026 |
| Coperniq | Partly | Solutions page. Support page on financials |
| OpenSolar | Not stated | Help article, updated 23 Jul 2026 |
| Aurora Solar | Not stated | Features overview, updated 14 Apr 2026 |
- Solargraf: Analytics dashboard with KPI cards, average days between proposal stages, price per watt and average size, and permits by status. Limits: Account owners only. Close rate, margin and PTO not listed.
- Salesforce Sales Cloud: Built-in, customisable dashboards. Example shows pipeline by stage. Limits: Solar KPIs need setup. Page undated.
- monday.com: Dashboards pull data from connected boards into widgets. Limits: 20,000 items across connected boards. Connected boards limited by plan.
- Coperniq: Lists "solar-native dashboards" under commercial and industrial, "automated NTP→PTO tracking" and "real-time cost tracking per project". Limits: No KPI list or formulas. Performance claims on the page not used here.
- OpenSolar: Projects list exports to CSV for "analysis, reporting, or backup purposes". Limits: No dashboard described in that article.
- Aurora Solar: Features overview has a "Project Overview & Dashboard" section, but its content is video. Limits: No text on KPIs found.
For a wider view, see the best solar sales software, solar proposal software and solar estimating software.
Common mistakes with KPI dashboards
FAQs
Which KPIs should a solar installer track first?
Start with the seven on this page. They are lead-to-close, close rate, design turnaround, cost per watt, days to PTO, backlog and margin per job. Add rep, crew and state filters only once you trust the seven.
What is the difference between close rate and lead-to-close?
Close rate divides signed contracts by proposals presented, while lead-to-close divides them by all leads. Lead-to-close is the lower figure because leads outnumber proposals. In the example set the two were 40% and 11.1%.
How do you calculate days from contract to PTO?
Subtract the contract date from the PTO date for each finished job. Then take the median. Add the current age of open jobs so slow ones stay visible. Say whether your clock starts at contract or NTP.
How often should a solar company review its KPIs?
Review each KPI as often as you can act on it, and keep that rhythm fixed. Read sales KPIs on your sales cycle. Read margin only after jobs close, because job costs settle late. Note each KPI’s rhythm beside its definition.
Related terms
- Close rate: signed contracts as a share of proposals or leads.
- PTO: the utility’s permission to operate the system.
- Job costing: tracking the direct cost of each project.
Next step: agree the start and end date of each of your seven KPIs. Delivery and margin KPIs suit the best solar project management software, and lead and close-rate KPIs suit the best solar lead management software. Both start from your sales pipeline data.
Sources
All sources opened in October 2026.
- KPI definitions and ranges. Rework, solar sales KPIs (updated 2 July 2026). Perceptive Analytics (published 20 January 2025, modified 5 September 2025). Zuper KPI post (read, not used for figures).
- Software. Solargraf analytics dashboard. Salesforce Sales Cloud. monday.com dashboards. Coperniq solutions and Coperniq financials. OpenSolar projects list. Aurora features overview.
- Worked example: example dataset (SolarSoftwares).
Last updated 30 October 2026. Next scheduled review: 30 January 2027.