Key takeaways
- Companies publish different metrics. Of 6 company pages below, only 2 give a roof count: Nearmap (39 roofs) and OpenSolar (8 roofs, shading only).
- In this example’s 10.2 kW job, the meter read 10.6% under the design. Weather explained 438 kWh and as-built geometry 670 kWh, leaving a residual of -3.3%, inside our placeholder 5% tolerance.
- One missing module in 24 cost 4.2% of modelled energy. An 8 degree azimuth miss cost 0.2%. On this example site, count errors cost more than angle errors.
- A claim of "100% within tolerance" from 20 test jobs only bounds the failure rate at 13.9%. About 59 clean jobs bound it at 5%.
- An IEA PVPS Task 13 table prints per-step uncertainties that total 6.5%. Design checks remove avoidable slips. They do not remove that forecast uncertainty.
To check a design against the roof in software, see the best solar site survey apps.
Design accuracy at a glance
Design accuracy is the gap between what the design file says and what the roof and the meter show. You set the tolerance. No single standard sets it for you.
| Item | Detail |
|---|---|
| Formula | Variance = as built minus design, compared with a tolerance you set. Production residual = metered kWh ÷ (as-built model kWh × weather share) - 1. |
| Unit and range | Count, degrees, percentage points and kWh. Our worked tolerances are placeholders. |
| Where it matters | Permit set, install-day layout, proposal promises and production disputes. |
| Standard or rule | No single standard that sets a design tolerance is cited here. Your AHJ and your own quality rules decide. |
| In software | Design tools build the model, and some publish accuracy studies. Their metrics differ, so you cannot compare figures directly. |
Why does design accuracy matter for installers?
Errors are easier to fix before the permit than after install. Later they mean a revised permit set, a changed layout or an argument over output.
Some slips are small. The costly ones can be a module count that does not fit or a shade source that grew. For what changes on paper, see permit plan set and handover pack and as-built documentation.
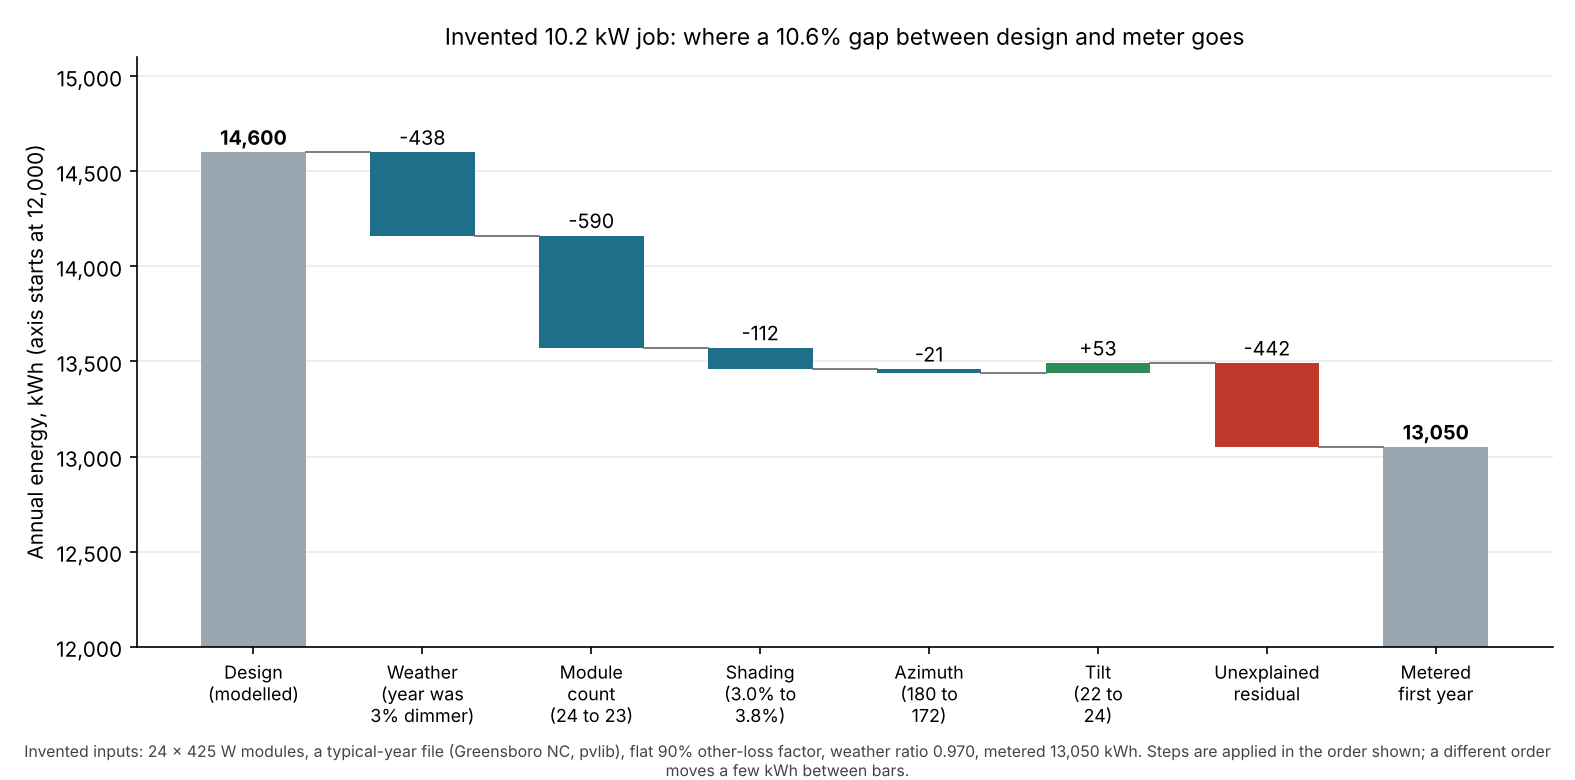
Figure 1. On this example’s job, weather and one missing module explain 1,028 of the 1,550 kWh gap. The unexplained part is 442 kWh.
Which parts of a design can be wrong?
Each of the four design layers has its own check, and the simulation adds a fifth source of error. Geometry, shading, layout and electrical errors are design errors. The simulation adds uncertainty even when the design is right.
| Layer | What can drift | What checks it | Read more |
|---|---|---|---|
| Roof geometry | Plane size, pitch and azimuth traced from an image or model. | Tape or laser, drone model or LiDAR points. | Roof measurement |
| Shading | Trees that grew or were cut, missed obstructions, old imagery. | Skyline reading on site, dated imagery. | Shading analysis |
| Layout and module count | Vents, setbacks and rafters that move the grid. | Install-day layout against the plan. | Solar panel layout, keep-out zones |
| Electrical design | Panel rating, string size or cable run read wrongly. | A second reviewer checks the diagram against site photos. | String sizing, single line diagram |
| Simulation | Weather data, model and loss assumptions. | Weather-corrected comparison with the meter. | Energy yield simulation |
How big is simulation uncertainty beside design error?
It is larger than the one-module slip in our example. A perfect design still carries forecast uncertainty. So a design check cannot promise a kWh figure.
The IEA PVPS Task 13 report T13-18:2020 (November 2020) has a table that lists an uncertainty for each modelling step. It prints 4.0% for global horizontal irradiation and 2.5% for irradiation on the module plane. Object shading gets 3.0% and row shading 2.0%. It prints a total of 6.5%. The executive summary does not say how the total is made.
The same report shows how assessors differ. At Bolzano, P50 estimates ranged from 1,095 to 1,406 kWh/kWp. The measured average for 2010 to 2019 was 1,275. One missing module in 24 is 4.2%, about as large as the 4.0% irradiation figure. One is a bias and the other an uncertainty, but both move the answer. For P50 and P90 see P50, P90 and P99.
How do installers validate a remote design?
They stack checks. Each method catches some errors and misses others. Only the as-built comparison closes the loop. The table says what each one cannot see.
| Method | Catches | Cannot see | Read more |
|---|---|---|---|
| Site visit | Roof, panel, meter and access, by hand. | Only what the notes and photos record. | Site survey |
| Aerial imagery | Outline and large obstructions on a dated image. | Anything built after the capture date. | Aerial imagery |
| Drone survey | Measured heights and a scaled map. | Framing and the inside of the panel. | Drone survey |
| LiDAR | Pitch and heights from points. | Walls, new builds and small vents. | LiDAR |
| Second review | A second person checks the design file against the data and photos. | Errors in source data both people share. | Remote site assessment |
| As-built comparison | Final layout and meter against the design. | Nothing before install. It tunes the next job. | Handover pack |
Our ranking of the best solar site survey apps covers the survey tools used to check a design against the roof.
Worked example: design against as built
The check has 3 steps. Compare the design values. Re-run the model with the as-built values. Then weather-correct the meter. The job is example: a 10.2 kW roof array.
Model: pvlib 0.16.1 with a typical-year file for Greensboro NC, as a stand-in site. It uses 425 W modules and a flat 90% other-loss factor in both runs. Tolerances are our placeholders.
| Item | Design | As built | Variance | Tolerance | Result |
|---|---|---|---|---|---|
| Modules | 24 | 23 | -1 (-4.2%) | ±0 | Fail |
| Tilt | 22° | 24° | +2° | ±3° | Pass |
| Azimuth | 180° | 172° | -8° | ±5° | Fail |
| Shading loss | 3.0% | 3.8% | +0.8 points | ±1.0 point | Pass |
| Modelled energy | 14,600 kWh | 13,909 kWh | -4.7% | ±2% | Fail |
The meter then read 13,050 kWh for the first year. That is 10.6% under the design. Measured irradiance was 97.0% of the typical year (example). Weather comes out first. Then come the as-built changes.
| Step | kWh |
|---|---|
| Design, modelled typical year | 14,600 |
| Weather (97.0% irradiance) | -438 |
| Module count, 24 to 23 | -590 |
| Shading, 3.0% to 3.8% | -112 |
| Azimuth, 180° to 172° | -21 |
| Tilt, 22° to 24° | +53 |
| Expected for the as-built system that year | 13,492 |
| Unexplained residual (-3.3% of expected) | -442 |
| Metered first year | 13,050 |
The raw gap looked like a design failure. Most of it was weather and one dropped module. The -3.3% residual passes our 5% placeholder. Tilt, shading and azimuth together are small. Applied one at a time from the design, the effects are -4.2% (modules), -0.8% (shading), -0.2% (azimuth) and +0.4% (tilt).
The residual is not a diagnosis. It can hold soiling, inverter faults, degradation or a wrong irradiance share. See performance ratio. Three of the five rows fail, so the as-built record needs an update.
Variance and sample-size calculator
Enter your design values, as-built values, meter reading and tolerances. The lower part tells you how many test jobs a claim needs. It starts with the example job above.
If the calculator does not load, open the design variance and sample-size calculator on its own page.
How solar software handles design accuracy: what companies claim
Four of the six company pages we read in October 2026 print an accuracy figure, and only Nearmap states a full sample. The metrics differ, so the figures cannot be ranked against each other.
| Software | Figure printed? | Sample stated? | Page and date |
|---|---|---|---|
| OpenSolar | Yes | Partly | Accuracy page, modified 20 January 2026. |
| Nearmap | Yes | Yes | Roof measurements page, undated, © 2026. |
| EagleView | Yes | Not stated | Press release, 4 June 2025. |
| HelioScope | Yes | Not stated | Page modified 7 August 2026. |
| Aurora Solar | Not stated | Not stated | Help page. No date shown when re-checked 30 October 2026. |
| Google Solar API | Not stated | Not stated | Building insights page, updated 21 October 2026. |
"Yes" in the figure column means the page prints a number. Partly: the sample is given for shading only. Not stated: the page we cite does not say.
Figure, reference and sample for each company:
- OpenSolar
- Figure: Scale within 1 ⅓ feet 100% of the time. Pitch within 4 degrees over 97%. The page credits PVEL’s field measurements.
- Production: 0.0-0.2% of SAM and 0.1-1.9% of PVsyst. Shading within ±2.63 (Los Angeles) and ±2.69 (Denver) solar access values.
- Compared against: Field measurements (PVEL), other models, and SunEye readings.
- Sample: Shading: 81 points on 8 roofs (see below). Roof count for scale and pitch not stated.
- Nearmap
- Figure: Roof area ±1.6% against manual measurements.
- Compared against: Manual measurement by Haag Engineering, hired by Nearmap.
- Sample: Yes. 39 US roofs. Total area 0.1% different. 1.6% per building, 2.2% per roof section.
- EagleView
- Figure: Roof lines 98.77%, area 98.43%, slope 98.49%.
- Compared against: Drone and terrestrial LiDAR by CompassData, Denver single-family homes.
- Sample: Not stated. The release does not define "accuracy".
- HelioScope
- Figure: Estimates "within 1% of PVsyst".
- Compared against: PVsyst. The page we cite does not name a third-party validator. A separate 2014 DNV GL review checked how HelioScope modelled Tigo Energy optimisers against PVsyst, which is a narrower claim than overall accuracy.
- Sample: Not stated. Method not on the page.
- Aurora Solar
- Figure: No accuracy figure. The page says NREL validated the engine and calls output "comparable (and, in fact, is often better)" than other software.
- Compared against: Other simulation software, for the systems studied.
- Sample: Not stated.
- Google Solar API
- Figure: The page gives no accuracy figure.
- Compared against: It reports imageryQuality and imageryDate per result.
- Sample: Not stated.
OpenSolar’s page says its shading test used 81 points on 8 roofs. Its production figures and HelioScope’s compare against other models (SAM, PVsyst). Agreement with a model is not agreement with real output.
Scanifly’s R&D blog post (16 April 2021) says its official commitment is accuracy within 2-3 inches, from an in-house test comparing drone measurements with tape-measure readings on three roofs. The Arka 360 page that cited an EPC’s output deviation falling from 10% to under 3% has since been taken down, so we cannot re-check it (checked November 2026). Both figures rest on single, company-run comparisons.
A third-party check, run by NREL with Aurora, is a short NREL report. It covers Aurora’s earlier Envision tool, which read Street View photos. NREL tested 60 measurements on 15 Denver-area roofs against Aurora’s targets. Slopes: 27 of 28 within 5 degrees. Lengths: 32 of 32 within 1.5 feet.
How to test a claim on your own jobs:
- Pick finished jobs with known as-built values. Include hard roofs, not only easy ones.
- Run the tool blind, without looking at the as-built values.
- Measure the as-built values the same way on every job.
- Record the mean error, the worst error and the jobs outside your tolerance.
- Quote the failure count with its bound, not just "all passed".
| Result (jobs outside tolerance) | 95% upper bound on failure rate |
|---|---|
| 0 of 20 | 13.9% |
| 0 of 32 (like NREL’s lengths) | 8.9% |
| 1 of 28 (like NREL’s slopes) | 15.9% |
| 0 of 59 | 4.95% |
Method: one-sided exact binomial bound, assuming independent jobs. Measurements on one roof are not independent, so NREL’s real bounds are wider. The best solar simulation software list covers the tools that turn a design into kWh.
Common mistakes with design accuracy
FAQs
How accurate is a remote solar design?
Company-reported only: Nearmap prints roof area within 1.6% on 39 roofs. OpenSolar prints pitch within 4 degrees over 97%, with no roof count. No neutral figure covers all tools, and the metrics differ. Test the tool on your own finished jobs.
Why does a system not match its design estimate?
The year’s weather, differences between design and build, losses or faults, and the estimate’s own uncertainty all move it. Sort them in that order before blaming the design.
Do you need a site visit to validate a remote design?
Not always. A visit is the only method here that reads framing and panel ratings first-hand, while a second review or an as-built comparison catches other errors. To see which jobs still need one, read remote site assessment.
How many jobs do you need to test a company’s claim?
For a 5% failure-rate bound with no failures you need 59 jobs. For a 10% bound you need 29. Any failure raises the number you need.
Related terms
- Roof measurement: sizing roof planes, pitch and azimuth before design.
- Energy yield simulation: the model that turns a design into kWh.
- Handover pack and as-built documentation: the records that show what was built.
- AI auto design: software that drafts an array layout for you to review.
Next step: check your next finished job against the roof in the best solar site survey apps, then its kWh in the best solar simulation software.
Sources
- OpenSolar: accuracy, page modified 20 January 2026 (checked October 2026).
- Nearmap: roof measurements and exterior measurements, undated, © 2026 (checked October 2026).
- EagleView: roof measurements confirmed to be 98.77% accurate, 4 June 2025 (checked October 2026).
- HelioScope, page modified 7 August 2026 (checked October 2026).
- Aurora help: Aurora Simulation Engine, no date shown when re-checked (checked 30 October 2026).
- Google Solar API: building insights, last updated 21 October 2026 (checked October 2026).
- NREL: Validation of Aurora Solar Inc.’s Envision software capabilities, NREL/FS-7A40-67790. The OSTI record names the lab as National Renewable Energy Lab (checked 30 October 2026). The lab is now the National Laboratory of the Rockies (U.S. Department of Energy, 1 December 2025).
- NREL: Comparing the OpenSolar Remote Shading Analysis Tool to On-Site Shading Measurements, NREL/FS-5R00-81316. ±2.63 SAV in Los Angeles and ±2.69 in Denver (checked 30 October 2026).
- IEA PVPS Task 13: Uncertainties in yield assessments and PV LCOE, executive summary, report T13-18:2020, November 2020 (checked October 2026).
- Scanifly: Our R&D Process in Action, 16 April 2021 (link checked November 2026. The earlier accuracy-ebook page we cited has gone).
- Arka 360: solar design automation and accuracy, 10 November 2025. The page returned a 404 error when we checked again in November 2026, so the link is removed. We keep the EPC claim with a caveat because we read it on the live page in October 2026.
Last updated 30 October 2026. Next scheduled review: 30 January 2027.