Key takeaways
- Terms are not standard. One company calls a few-day check a feasibility study. Solargis ties detailed yield and bankable reports to feasibility.
- This example’s 40 ha parcel fits 25.20 MWdc on land. Grid headroom allows only 19.50 MWdc. The grid sets the limit until 45.8% of the parcel is excluded.
- At 0.058 USD per kWh (example, flat) the project earns a 5.36% IRR. At an 8% hurdle rate (example) NPV is -4,344,935 USD. Break-even price is 0.0712 USD per kWh.
- In Figure 1 (right), a 10% change in price or yield moves IRR by about 1.2 points. Capex moves it by about 1.0. Parcel area moves it by 0.00 while the grid limit binds.
To run a yield and layout pass in software, see the best utility-scale solar design software.
Feasibility study at a glance
A feasibility study is a decision tool. It costs less than design and construction. It should end with a clear recommendation.
| Item | Detail |
|---|---|
| What it is | A test of site, grid, permits, yield and cost, with stated assumptions and a recommendation. |
| Output | Go, no-go, or go with changes, plus the risks and assumptions behind the call. |
| Duration | GreenLancer, a service company, says a small screening takes a few days. It says commercial and utility-scale studies take a few weeks to a few months. |
| Standard or rule | No single standard is cited. Scope depends on who writes it and for whom. |
| In software | Tools state feasibility-stage use for yield, layout and finance. None of the pages read states a permit step. |
Why does a feasibility study matter for installers and developers?
It lets you stop a bad project early. You save the cost of design, surveys or grid fees. NREL (renamed NLR in December 2025)’s 2012 slides (slide 25) say to hold the go/no-go decision until the end. They call for "incremental decisions followed by incremental investments".
On a rooftop job, a site survey and a proposal do this work. On a ground-mount or utility project, the study decides if you pay for the next stage.
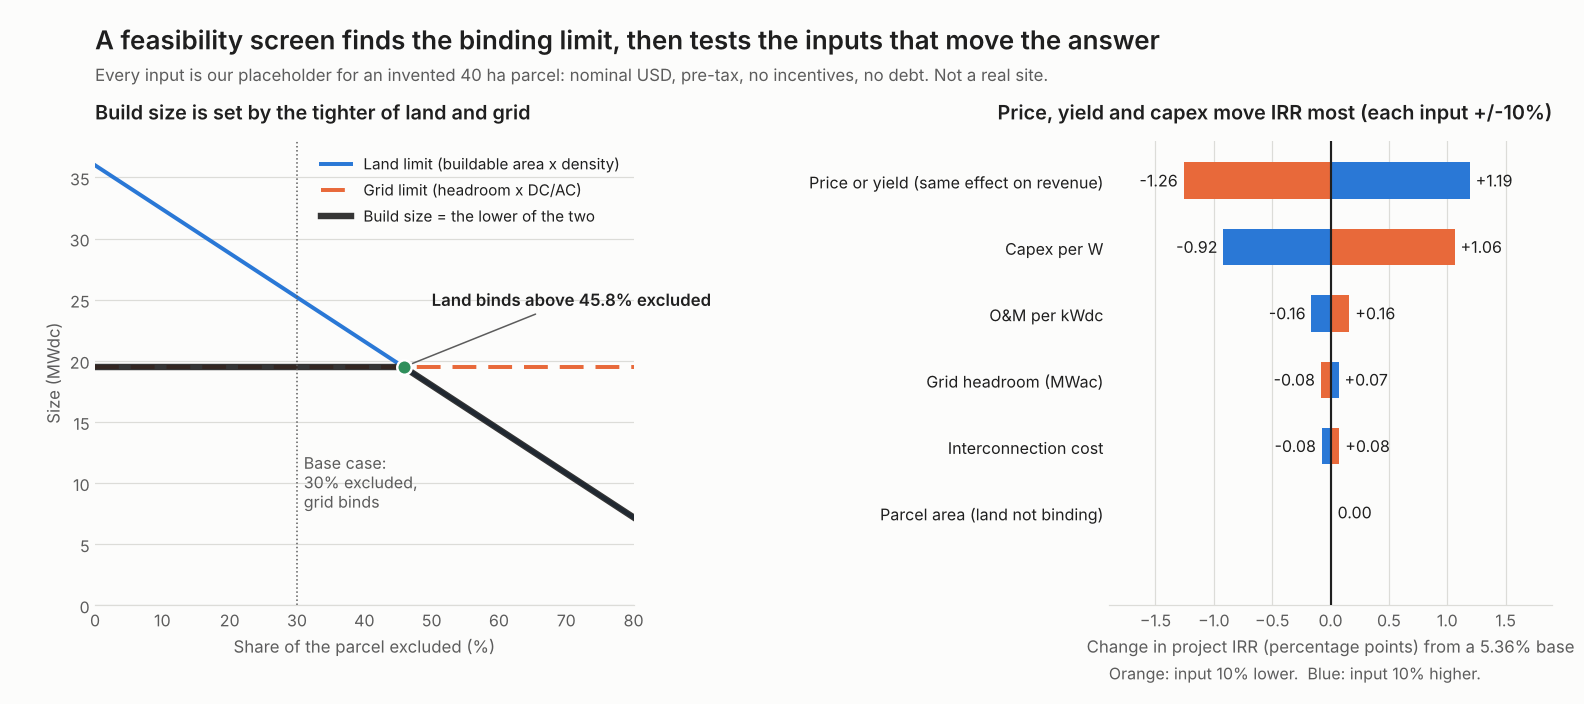
Figure 1. On this example’s parcel the grid limit sets the build size until 45.8% of the land is excluded, and price, yield and capex move IRR far more than land does.
What does a feasibility study cover?
It covers whatever can stop the project. GreenLancer’s page lists many items. These are resource and shading, usable area, structural and civil conditions, grid capacity, permitting, cost, incentives, payback and site control. The table groups them into six workstreams.
| Workstream | Question it answers | Where to read more |
|---|---|---|
| 1. Site control and land | Who can lease or sell, and how much area is buildable? | Land parcel data, GIS |
| 2. Resource and yield | How many kWh per kWdc after losses? | Solar resource data, energy yield simulation |
| 3. Layout and terrain | How many MWdc fit around slopes and setbacks? | Terrain modelling, layout optimisation |
| 4. Grid | How much can connect, and at what upgrade cost? | Interconnection queue, interconnection application |
| 5. Permits and environment | Is the use allowed, and what review applies? | Setbacks |
| 6. Economics and risk | Does it beat the hurdle rate, and what moves the answer? | NPV, IRR, LCOE |
The EPA has a screening tool for solar on contaminated land and landfills. It shows what early tests look like. These are that tool’s tests, not rules. The document has no date, and its references go back to 2011.
- Is the solar resource rated Good, above 3.5 kWh/m²/day?
- Is there at least 2 acres for ground mount (rooftops use 30,000 sq ft)?
- Is the site within 1/2 mile of lines?
- Is the slope of the land under 6 degrees (ground mount)?
What is the difference between screening, pre-feasibility and feasibility?
Each pass adds detail and cost. No standard fixes the lines between them.
- Screening. The EPA tool calls itself "a process for screening sites". It is "not intended to replace or substitute the need for a detailed site-specific assessment".
- Pre-feasibility. Solargis’s 2026 leaflet links this stage to Prospect. It lists "Land securing", "Benchmarking project opportunities" and "Preliminary PV energy yield analysis".
- Feasibility. The same leaflet links this stage to Evaluate. It lists "Design optimization", "Detailed PV energy yield simulation" and "Bankable reports to secure project financing". See bankable energy yield.
Names clash. GreenLancer uses "feasibility study" for a screening it usually finishes in a few days. Treat the label as loose and compare what each study tested. NREL’s slide 25 adds that the process is iterative. It warns against "mistaking each iteration for final go/no-go".
Worked example: a 40 ha screen, land against grid
The parcel can hold 25.20 MWdc. The grid takes only 19.50 MWdc. The screen builds 19.50 MWdc and returns a 5.36% project IRR. The calculator below reproduces every figure.
| Input (example placeholders) | Value |
|---|---|
| Parcel and exclusions | 40 ha, 30% excluded for flood, wetland, setbacks and slope, leaving 28.0 buildable ha |
| Density | 0.9 MWdc per buildable ha, so 25.20 MWdc on land. Real density depends on layout. See layout optimisation |
| Grid | 15 MWac headroom at DC/AC 1.30, so 19.50 MWdc. See DC/AC ratio |
| Capex | 1.00 USD per W plus 1,500,000 USD interconnection = 21,000,000 USD at year 0 |
| Energy and price | 1,650 kWh per kWdc in year 1, 0.5% a year degradation. 0.058 USD per kWh, flat |
| O&M, life, hurdle | 10 USD per kWdc rising 2% a year. 25 years. 8% nominal hurdle rate |
| Left out | Tax, incentives, debt, land lease, decommissioning, reserves and fees |
| Result | Value |
|---|---|
| Build size | 19.50 MWdc, set by the grid |
| Year-1 energy, revenue, O&M, net | 32,175 MWh. 1,866,150. 195,000. 1,671,150 USD |
| Project IRR | 5.36% |
| NPV at 8% | -4,344,935 USD |
| Break-even year-1 price at 8% | 0.0712 USD per kWh, against 0.058 assumed |
| Break-even capex at 8% | 0.777 USD per W, against 1.00 assumed (interconnection fixed) |
The study’s job is to say what has to be true. The next table changes one input at a time. All others stay at base.
| Change | Build size | Project IRR | NPV at 8% (USD) |
|---|---|---|---|
| Price 0.050 USD per kWh | 19.50 MWdc | 3.60% | -6,983,073 |
| Price 0.066 | 19.50 MWdc | 6.99% | -1,706,797 |
| Price 0.075 | 19.50 MWdc | 8.72% | +1,261,108 |
| 60% of parcel excluded | 14.40 MWdc (land binds) | 5.10% | -3,600,875 |
| Grid headroom 10 MWac | 13.00 MWdc (grid binds) | 5.00% | -3,396,624 |
| Interconnection 3,000,000 USD | 19.50 MWdc | 4.65% | -5,844,935 |
At 6% and 10% hurdle rates (example) the base NPV is -1,203,003 and -6,742,715 USD. A positive NPV at 0.075 would still leave site control, grid and permit gates open. See NPV and IRR for the method.
Feasibility screen calculator
The presets match the table above. The calculator warns you about values it cannot use.
How solar software handles feasibility studies: tools that state feasibility-stage use
RatedPower, Solargis Prospect, Solargis Evaluate and RETScreen each state feasibility-stage use, and none of the pages read states a permit step. RETScreen covers financial feasibility only. Pages were read in October 2026.
| Software | Feasibility-stage use? | Source |
|---|---|---|
| RatedPower | Yes | RatedPower Plan page, undated |
| Solargis Prospect | Yes, pre-feasibility | Solargis knowledge base, published 18 February 2025, updated 24 September 2026. Features page undated |
| Solargis Evaluate | Yes | Solargis leaflet, © 2026, no other date |
| RETScreen | Partly | Natural Resources Canada, date modified 21 January 2026 |
Partly: the page covers only part of the feasibility work, here finance.
- RatedPower: basic tier covers "engineering and feasibility studies for your utility-scale plants". Boundary with buildable and restricted zones, cut-and-fill, layouts, and "Energy yield, LCOE and CAPEX together". IRR not stated on these pages.
- Solargis Prospect: helps "assess potential gains and losses during the pre-feasibility phase". Yield, a financial analysis section and site comparison. Features page calls the finance tool "a first approximation" of return.
- Solargis Evaluate: leaflet lists "Design optimization", "Detailed PV energy yield simulation" and bankable reports under the feasibility stage.
- RETScreen: says it helps "determine if a proposed energy project makes financial sense". Financial feasibility only on the page read. No layout, grid or permit step stated.
For tools that carry a project from yield to layout, see the best utility-scale solar design software list. For yield models alone, see the best solar simulation software list.
Common mistakes with feasibility studies
FAQs
How long does a solar feasibility study take?
A residential or small commercial screening usually takes a few days, per GreenLancer. The same page says a commercial study often takes one to a few weeks, and utility-scale or complex sites can take several weeks to a few months. These are one company’s statements.
What is the difference between a feasibility study and a site survey?
A site survey collects measured facts about a roof or site. A feasibility study uses those facts, plus grid, permit and cost evidence. Then it decides whether to proceed. For a drawn layout, see the site plan.
Is a positive NPV enough to proceed?
No. NPV tests only the economics at one chosen rate. Our 0.075 USD per kWh case gives +1,261,108 USD. Land, grid and permits still need to clear. Each gate needs its own check, then test the inputs that move the result.
How much does a solar feasibility study cost?
Cost is driven by scope: whether it includes a field survey, a grid check and a financial model. GreenLancer’s page says price depends on scope and gives no dollar figures. Ask each provider to list what is in scope.
Related terms
- Site survey: the measured inputs a study starts from.
- Interconnection queue: the grid timing a study has to allow for.
- NPV: the discounted economics.
Next step: once the screen says go, compare utility-scale design tools for the next stage, or simulation tools for yield alone.
Sources
- GreenLancer: solar energy feasibility study, published 10 September 2026, updated 8 October 2026 (checked October 2026). A service company.
- US EPA: solar decision tree, undated, references to 2011 (checked 30 October 2026).
- NREL: Getting from Goals to Projects in the Ground, Bob Springer, slides dated 27 March 2012, slide 25 (checked October 2026).
- Solargis: Prospect and Evaluate leaflet, © 2026 (checked October 2026).
- Solargis knowledge base: Introduction to Prospect, updated 24 September 2026, and Prospect features, undated (checked October 2026).
- RatedPower: Plan and solutions for project developers, undated (checked October 2026).
- Natural Resources Canada: RETScreen, date modified 21 January 2026 (checked October 2026).
Last updated 30 October 2026. Next scheduled review: 30 January 2027.